Space can be a wondrous place, and we've got the pictures to prove it! Take a look at our favorite space pictures here, and if you're wondering what happened to today in space history don't miss our On This Day in Space video show here!
Starship launches on Test Flight 8
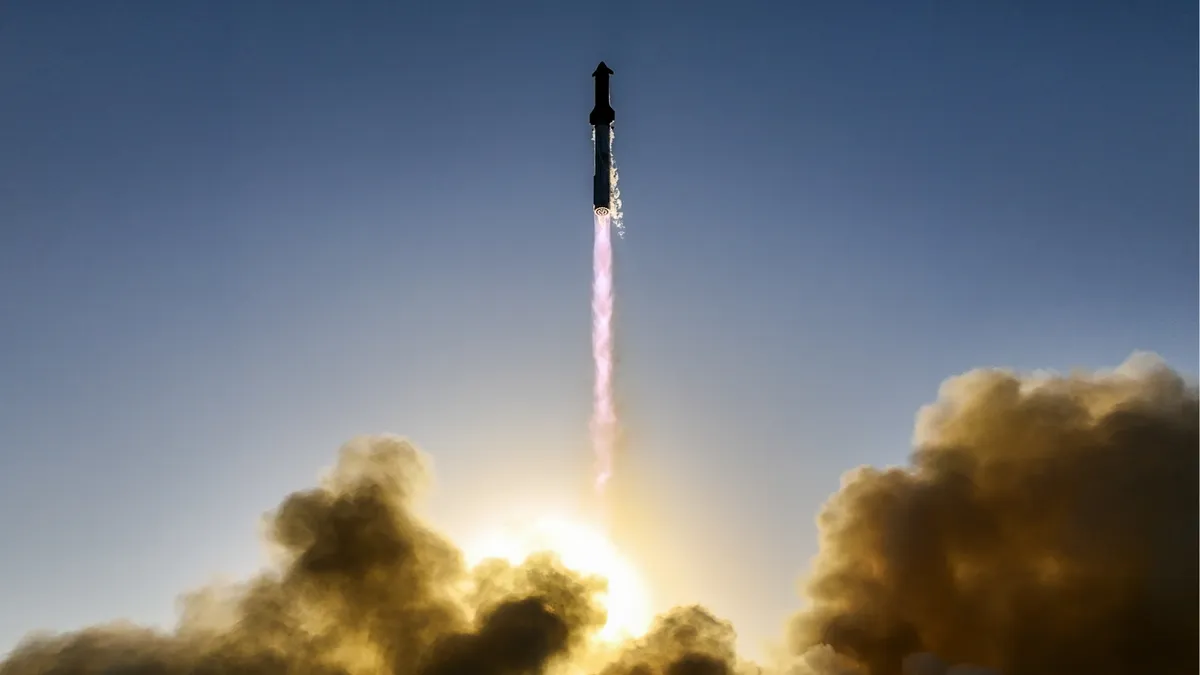
Friday, March 7: As today's image attests, Starship's eighth test flight started off well enough.
Minutes after this image was captured from the Starbase site in South Texas on Thursday evening (March 6), the upper stage, Starship, or just "ship," encountered a serious problem that brought Test Flight 8 to a fiery end.
The explosion of the 171-foot-tall (52-meter) upper stage sent debris raining down across the Atlantic ocean. A similar explosion brought Starship's previous test flight, Test Flight 7, to a cataclysmic end on Jan.16, 2025.
It wasn't all bad news for this latest test of the most powerful rocker ever built. Seven minutes after launch, the first-stage booster, Super Heavy, came back to Starbase for a successful launch-tower catch.
Read More: Watch fiery SpaceX Starship Flight 8 debris rain down over The Bahamas (video)
Planets on Parade

Thursday, March 6, 2025: Astrophotographer Josh Dury took the photo you see above on Feb. 28, when seven planets — Mercury, Venus, Mars, Jupiter, Saturn, Uranus and Neptune — lined up on the same side of the sun. Dury photographed this rare cosmic event from the Mendip Hills, Somerset, U.K. The next time this s type of cosmic alignment should appear is the year 2040. — Samantha Mathewson
A rising blue sun
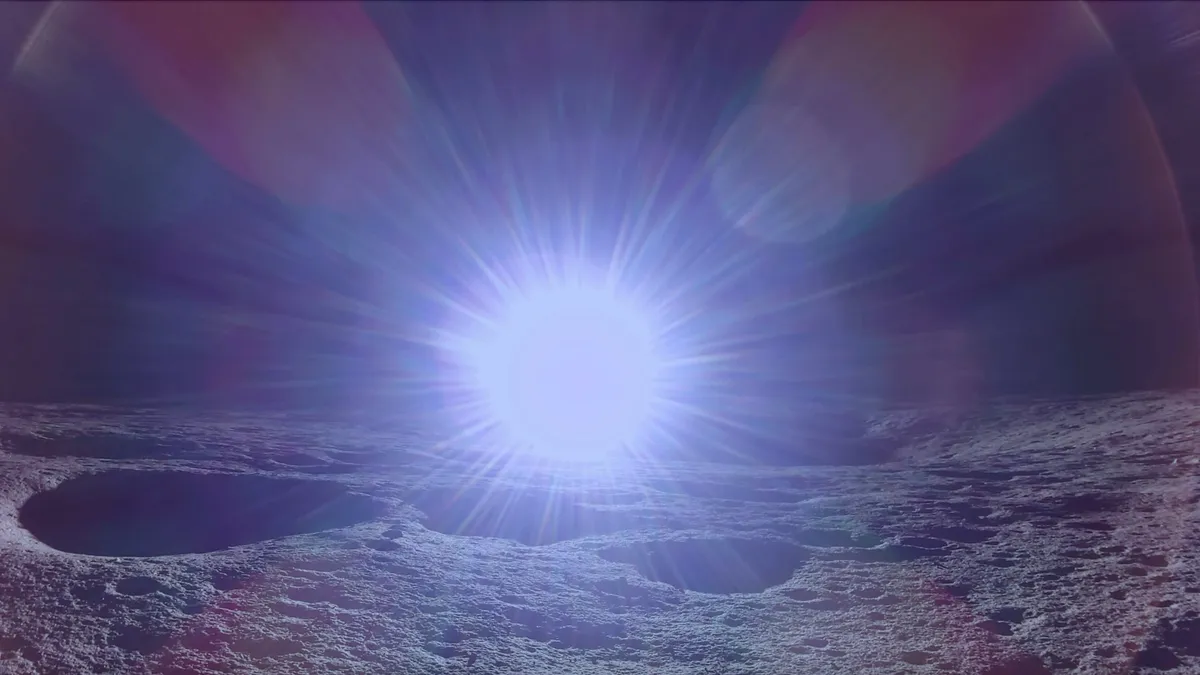
Wednesday, March 5, 2025: Firefly Aerospace's Blue Ghost lander has captured a gorgeous shot of sunrise on the moon as it begins its workday on the lunar surface. Blue Ghost aced its lunar landing attempt on Sunday (March 2), setting down close to Mons Latreille, a solitary lunar peak in the vast basin Mare Crisium ("Sea of Crises") in the northeastern region of the moon's near side. And the spacecraft is already getting to work, starting up its science payloads and capturing amazing images of its surroundings and the distant Earth from the lunar surface. — Andrew Jones
Starship is ready and waiting for flight 8

Tuesday, March 4: SpaceX's Starship megarocket stands ready and willing to go at the company's Starbase site in South Texas.
The biggest and most powerful rocket ever built was set to embark on Test Flight 8 on Monday evening (March 3).
The launch was scrubbed at T-40 seconds, with SpaceX citing issues with both of the launch system's stages, its Super Heavy booster and Ship upper stage.
SpaceX is now targeting 6:30 pm EST (2330 GMT) on Wednesday, March 5, for the test flight.
'We're on the moon!
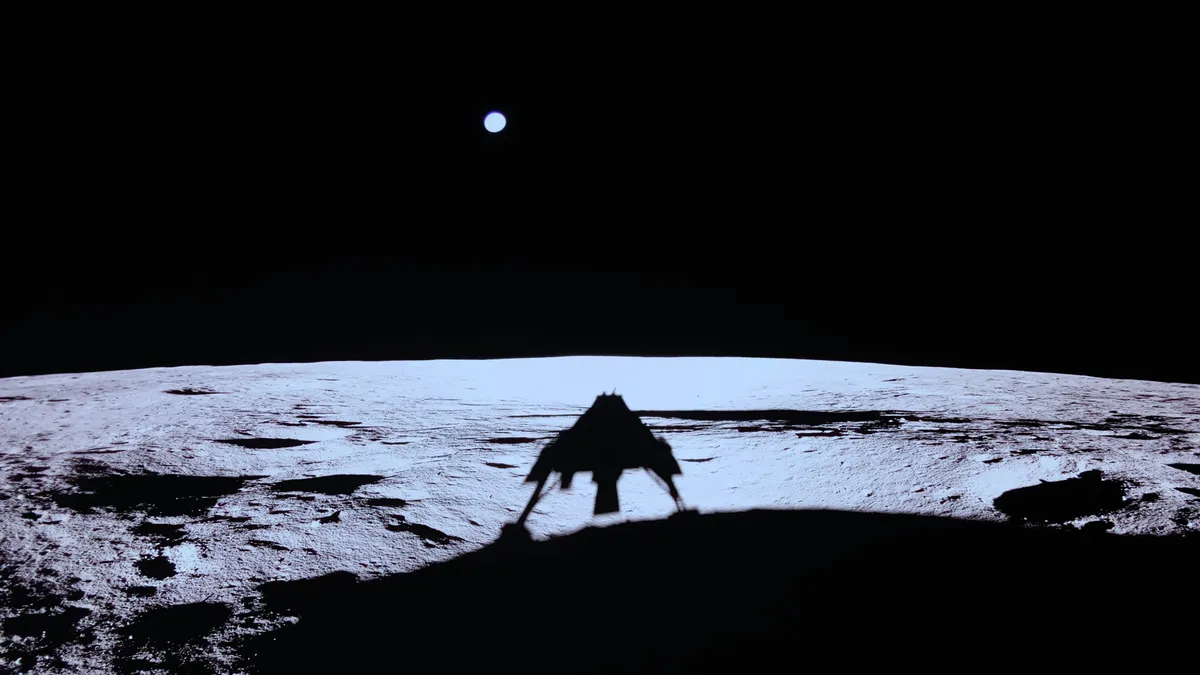
Monday, March 3, 2025: Firefly Aerospace's Blue Ghost moon lander has etched its name into the history books. Blue Ghost aced its touchdown early Sunday morning (March 2), becoming just the second private spacecraft ever to soft-land on the moon. This incredible image taken from the landing site in Mare Crisium (the Sea of Crises) by Blue Ghost were shared by Firefly just hours after the lunar landing.
February >
Can't find the date you're looking for? It may have been a weekend or holiday, when we don't normally update our Image of the Day. Check out the IOD Archives for more!
Image of the Day Archives
Image of the Day 2024 Archive
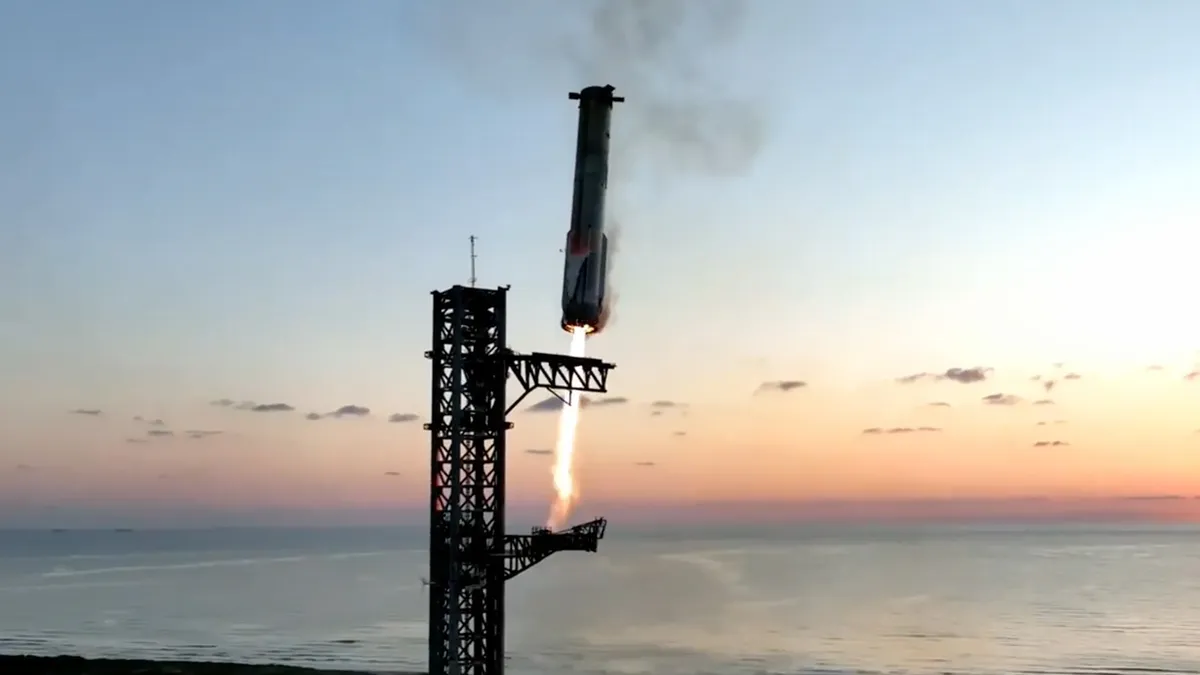
Image of the Day 2023 Archive
Image of the Day 2022 Archive
Image of the Day 2021 Archive
Image of the Day 2020 Archive
Click the navigation arrow below for February >