Heat Record: How NASA Knows 2016 Was the Hottest Year

The year 2016 was the warmest year in the modern record, NASA and National Oceanic and Atmospheric Administration (NOAA) officials said today (Jan. 18). Here's how they calculated that fact.
In a news conference today, NASA and NOAA released independent analyses of global temperatures that each came to the same conclusion: 2016 is very likely the hottest year on record, followed by 2015 and then 2014.
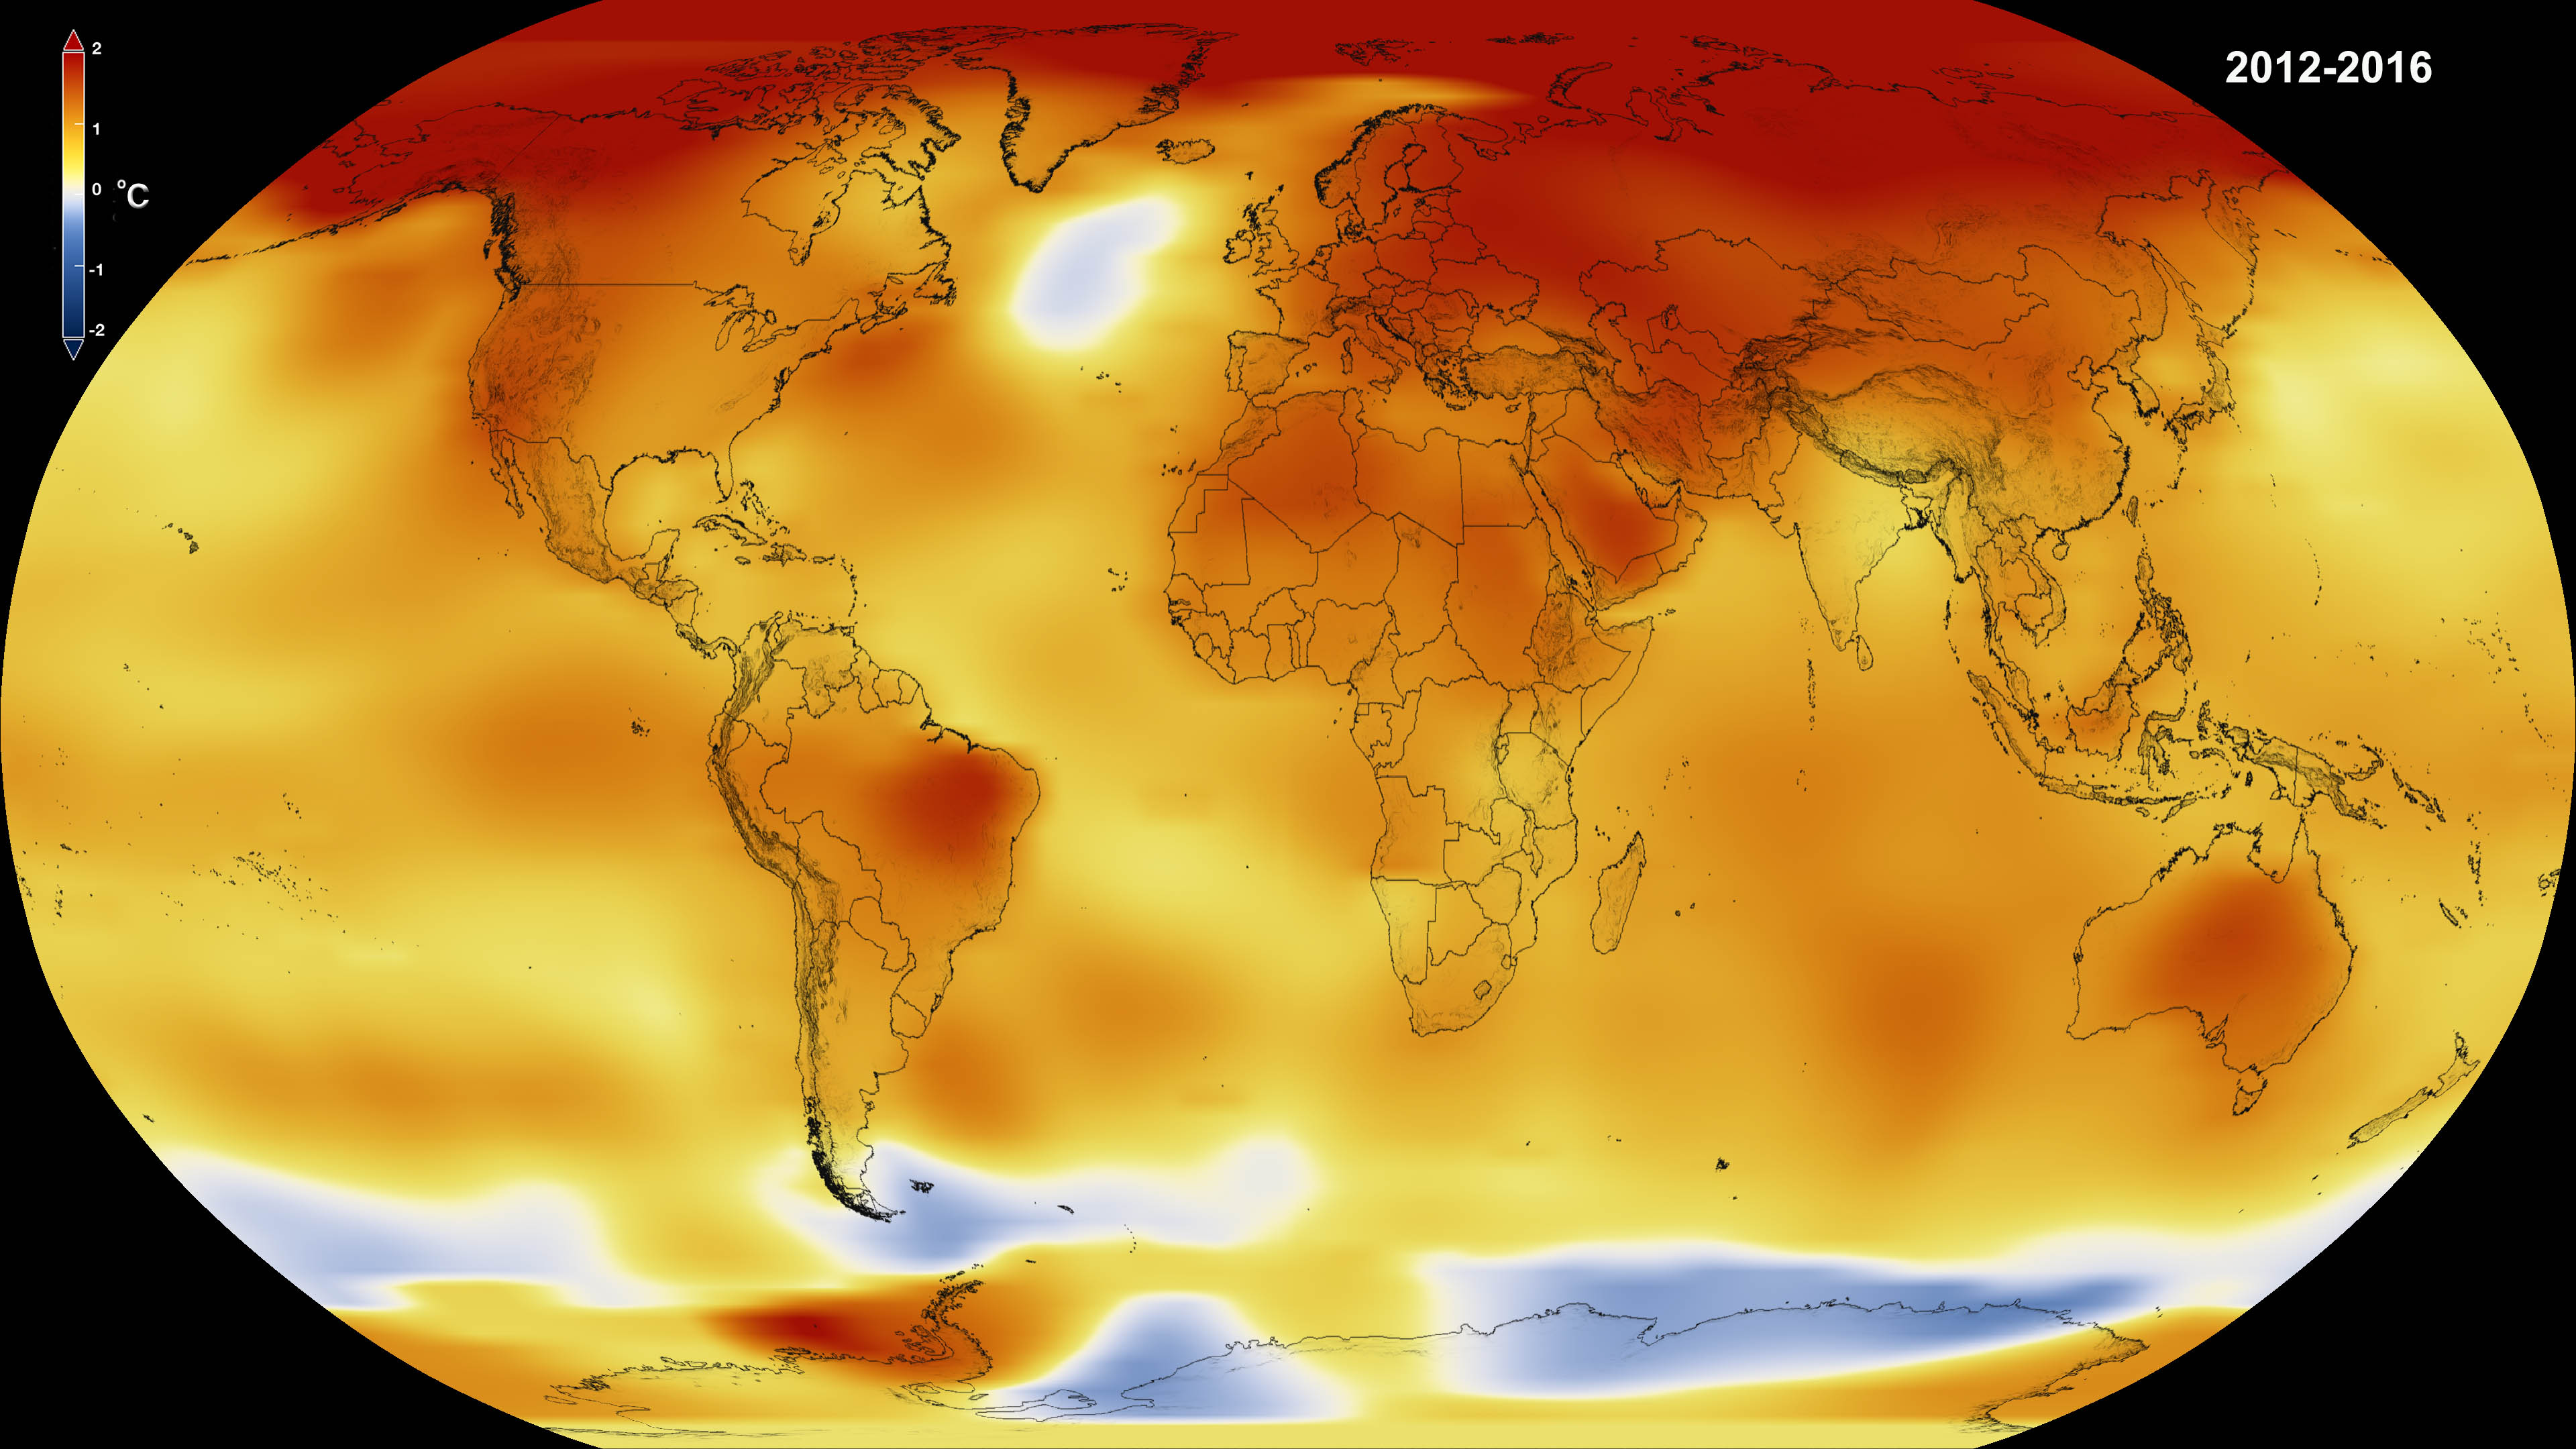
"You're seeing warmth throughout the world: higher on land than in the ocean, higher in the Northern Hemisphere than the Southern Hemisphere, higher in the arctic most of all, and patterns that we have grown quite familiar with both in modeling and in observation," Gavin Schmidt, director of NASA's Goddard Institute for Space Studies in New York, said during the conference. [2016 Warmest Year Ever - Largely Due To Human Emissions (Video)]
Measurements in agreement
NASA and NOAA both found a high likelihood that 2016 was the hottest year: a 96 percent chance according to NASA and a 62 percent chance according to NOAA. The only other contender — with a much lower probability — was 2015. The differing estimates come from different extrapolations of data about the warming Arctic. The region has warmed significantly, the panelists said, and how that's quantified can have a big effect on the average. But overall, the estimates are very similar, they said.
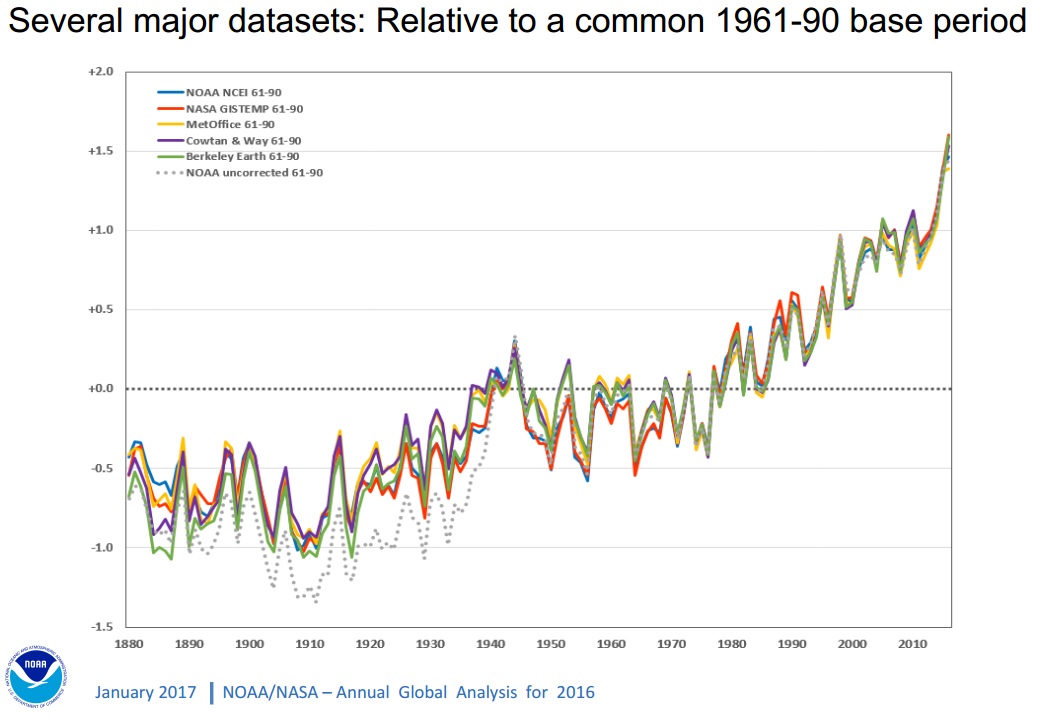
Derek Arndt, head of NOAA's National Centers for Environmental Information monitoring branch, presented records from groups using six different processes for monitoring global temperature, including the U.K. weather service Met Office, calculations from different academics and raw NOAA data that hasn't been corrected to account for changes in sea temperature measurements. All of these records showed a very similar, striking temperature increase, officials said.
"Especially since the mid-20th century, the analyses, while they have slight differences from year to year, are capturing the same long-term signal," Arndt said during the conference. "These data sets are all singing the same song, even if they're hitting different notes along the way. The pattern is very clear."
Tech and modeling
To measure global temperatures, NASA uses data from 6,300 weather stations, Antarctic research stations, and ships and buoys that measure sea surface temperature. The agency then analyzes the measurements using an algorithm that takes into account the stations' spacing and other elements that could affect measurements at particular stations, like a nearby urban area, NASA officials said in a statement. The key is weaving that data into a comprehensive picture of the overall temperature and changes.
Breaking space news, the latest updates on rocket launches, skywatching events and more!
NOAA uses much of the same temperature data, but analyzes it independently and calculates Arctic change differently (although still taking that change into account). Some analyses, including ones that don't show as big a change between 2015 and 2016, don't include an estimate of how the Arctic is changing, the researchers said in the conference. Essentially, this approach assumes the Arctic's temperature is changing at the same rate as that of the rest of the world. But measurements suggest the Arctic is actually warming two to three times faster than the mean globally, the researchers added.
To investigate the source of the climate's changes, researchers also analyzed satellite records of different parts of Earth's atmosphere, as well as radiosonde data, taken as individual balloons are released and rise through the atmospheric layers. The scientists found that temperatures had increased compared to past years at up to 40,000 feet (12,000 meters), but that the lower stratosphere has been cooling — likely because of ozone depletion and increasing carbon dioxide, the researchers said.
This pattern, plus an increasing ocean temperature, indicates that the planet is gaining energy and heat overall, the researchers said. Additionally, the atmospheric pattern suggests greenhouse gases are the cause, rather than something external, such as changes in the sun's heat, the scientists said. [What is the Temperature on Earth?]
Changes and absolute temperature
NASA researchers said that the mean Earth temperature for the year was 1.78 degrees Fahrenheit (0.99 degrees Celsius) hotter than the 20th century mean, which the scientists can declare with high accuracy, but that calculating the absolute global temperature for the year is a murkier proposition.
"There's a good reason we don't give an absolute temperature. It turns out the absolute temperature for the whole planet is a harder number to estimate than just the difference from one year to the next," Schmidt said. The researchers gave 57 degrees F (14 degrees C) as NOAA's estimate, but cautioned that this number was much less accurate than the amount of change.
"We can make statements about the differences year by year at the 10ths-, sometimes 100ths-of-degree level, but we don't know the absolute temperature of the planet that well. If you take one number that is not very well known and add it to a number that is very well known, it doesn't suddenly become more accurate," Schmidt added.
The reason researchers can estimate the change so much more accurately than the absolute temperature, they said, is that weather changes correlate strongly between locations, even when the locations themselves are at different temperatures. For instance, a storm system can be 1,000 miles (1,600 kilometers) across, and all the places in its path will follow a similar pattern of temperature change, regardless of their starting points. On a broader scale, temperature changes from month to month also correlate, even if the locations are different.
Calculating the overall changes lets the researchers check data from the different stations against each other for consistency, and requires fewer data points to get a strong estimate, the researchers said. By contrast, absolute temperature depends on the exact locations of stations and features like mountains, forests and cities that might not be covered well by the existing measurements.
"We have to do a lot more statistical interpolation to get the absolute temperature, whereas the anomalous temperature, [which documents] the changes — it's actually much easier," Schmidt said.
Editor's Note: This article mistakenly said that the Earth's temperature rose 1.78 degrees Fahrenheit (0.99 degrees Celsius) for the year. In fact, the Earth's mean temperature is 1.78 F (0.99 C) higher than the mid-20th century mean. However, it is still the third year in a row to set a surface temperature record.
Email Sarah Lewin at slewin@space.com or follow her @SarahExplains. Follow us @Spacedotcom, Facebook and Google+. Original article on Space.com.
Join our Space Forums to keep talking space on the latest missions, night sky and more! And if you have a news tip, correction or comment, let us know at: community@space.com.

Sarah Lewin started writing for Space.com in June of 2015 as a Staff Writer and became Associate Editor in 2019 . Her work has been featured by Scientific American, IEEE Spectrum, Quanta Magazine, Wired, The Scientist, Science Friday and WGBH's Inside NOVA. Sarah has an MA from NYU's Science, Health and Environmental Reporting Program and an AB in mathematics from Brown University. When not writing, reading or thinking about space, Sarah enjoys musical theatre and mathematical papercraft. She is currently Assistant News Editor at Scientific American. You can follow her on Twitter @SarahExplains.

