Satellites monitor California wildfires from space (photos)
Many eyes in the sky have been tracking the catastrophic blazes.
The intense heat and drought that sparked the catastrophic wildfires in the Western United States got an unfortunate boost by strong winds over the Labor Day weekend. Many satellites and other space-borne instruments have kept a vigilant eye on the developments of these blazes.
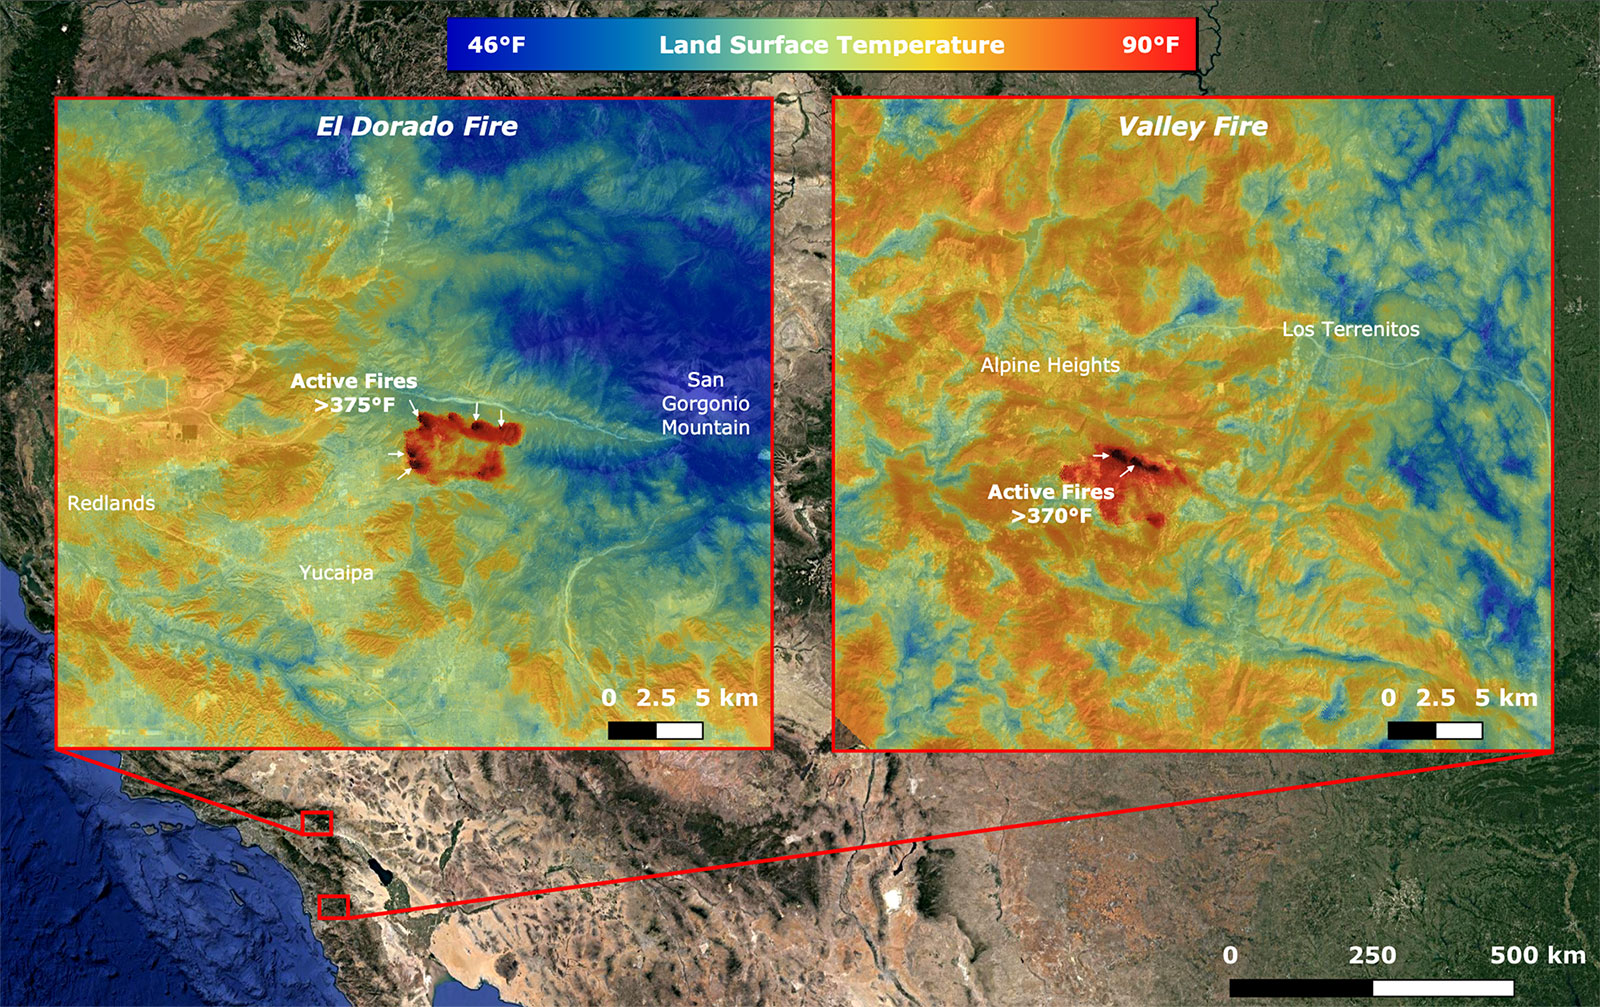
There were 25 major wildfires burning in California as of Labor Day (Sept. 7), according to a recent statement from NASA that detailed how an instrument aboard the International Space Station observed the fiery events from above. This Earth-observing technology, called ECOSTRESS (short for ECOsystem Spaceborne Thermal Radiometer Experiment on Space Station), imaged active fires across the state of California on Sunday (Sept. 6).
ECOSTRESS was designed by NASA's Jet Propulsion Laboratory to monitor the temperature of plants and landscape surfaces. Two images taken shortly after midnight local California time (0713 UTC, 12:13 a.m. PDT) on Sunday show several places where the active fires were likely occurring that night. These regions (in red) show where surface temperatures were higher than 370 degrees Fahrenheit (188 degrees Celsius).
The ongoing heat wave may be responsible for the surface temperatures highlighted in orange, which NASA officials said are ''abnormally warm'' temperatures from the middle of the night.
The El Dorado fire near Yucaipa and the Valley fire in Japatul Valley are active fires that ECOSTRESS captured in its imagery.
Another Earth-observing technology in space spotted Californian fires over the weekend. The National Oceanic and Atmospheric Administration (NOAA) GOES-17 satellite observed the growth of the massive Creek Fire in Fresno County.
Breaking space news, the latest updates on rocket launches, skywatching events and more!
SATELLITE SPOTLIGHT: This @NOAA #GOES17🛰️ loop from last Saturday shows how quickly Fresno County's #CreekFire grew after being sparked Friday evening. As of this afternoon, @CAL_FIRE says the #wildfire has grown to 144,000 acres and is 0% contained. #CaliforniaFires #CAwx pic.twitter.com/T8qLQkrwu9September 8, 2020
The Public Affairs division of NOAA Satellites published a tweet on Monday (Sept. 7) with a footage loop of the Creek Fire.
''This @NOAA #GOES17Satellite loop from last Saturday shows how quickly Fresno County's #CreekFire grew after being sparked Friday evening. As of this afternoon, @CAL_FIRE says the #wildfire has grown to 144,000 acres and is 0% contained,'' the tweet said.
ECOSTRESS and GOES-17 were accompanied in their wildfire observations by the NOAA/NASA Suomi NPP satellite.
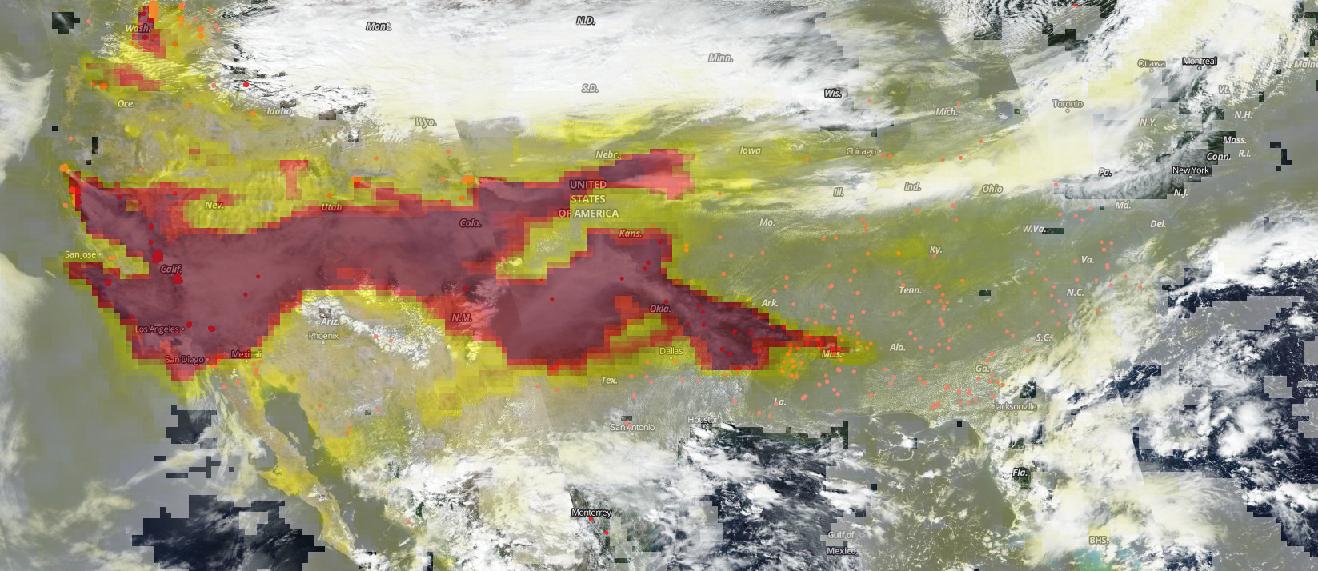
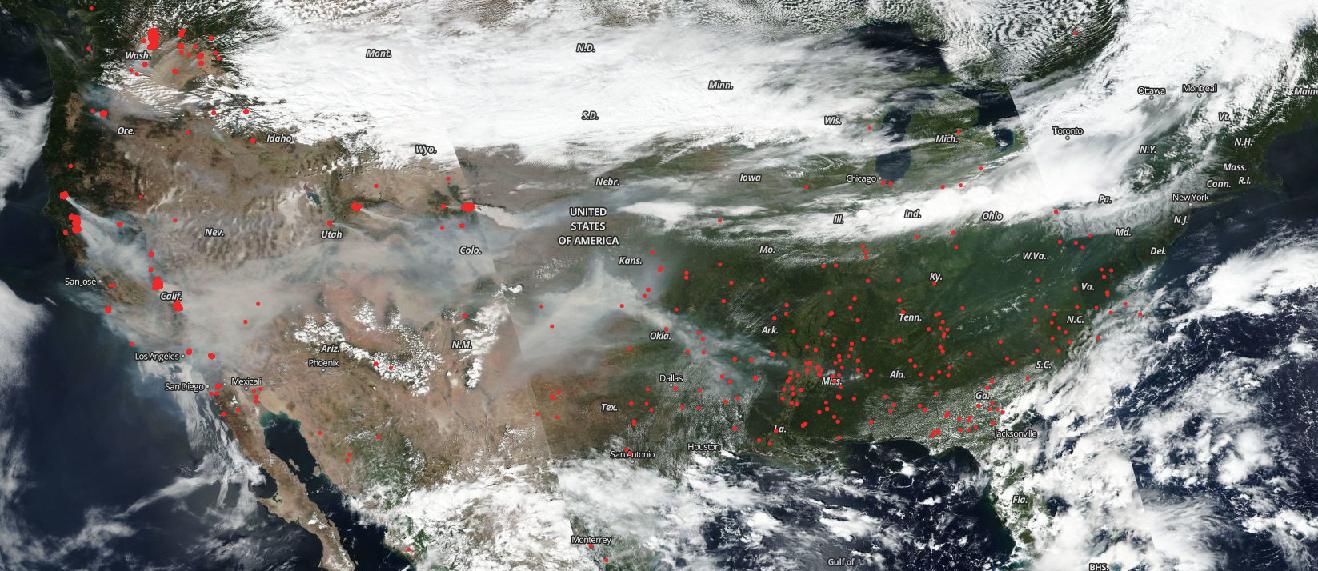
Suomi gathered data about the aerosols, or vaporized particles, carried into Earth's atmosphere as a result of fire plumes.
The aerosol view and the true-color image view show that the effects of West Coast wildfires are far-reaching. Regions within the deep-red range of the aerosol image have aerosol levels that may ''potentially be dangerous to the health of those in that area,'' according to a Sept. 8 NASA press release that describes the Suomi images.
''High aerosol concentrations not only can affect climate and reduce visibility, they also can impact breathing, reproduction, the cardiovascular system, and the central nervous system, according to the U.S. Environmental Protection Agency. Since aerosols are able to remain suspended in the atmosphere and be carried in prevailing high-altitude wind streams, they can travel great distances away from their source, as evidenced in these images, and their effects can linger,'' NASA officials wrote in the statement.
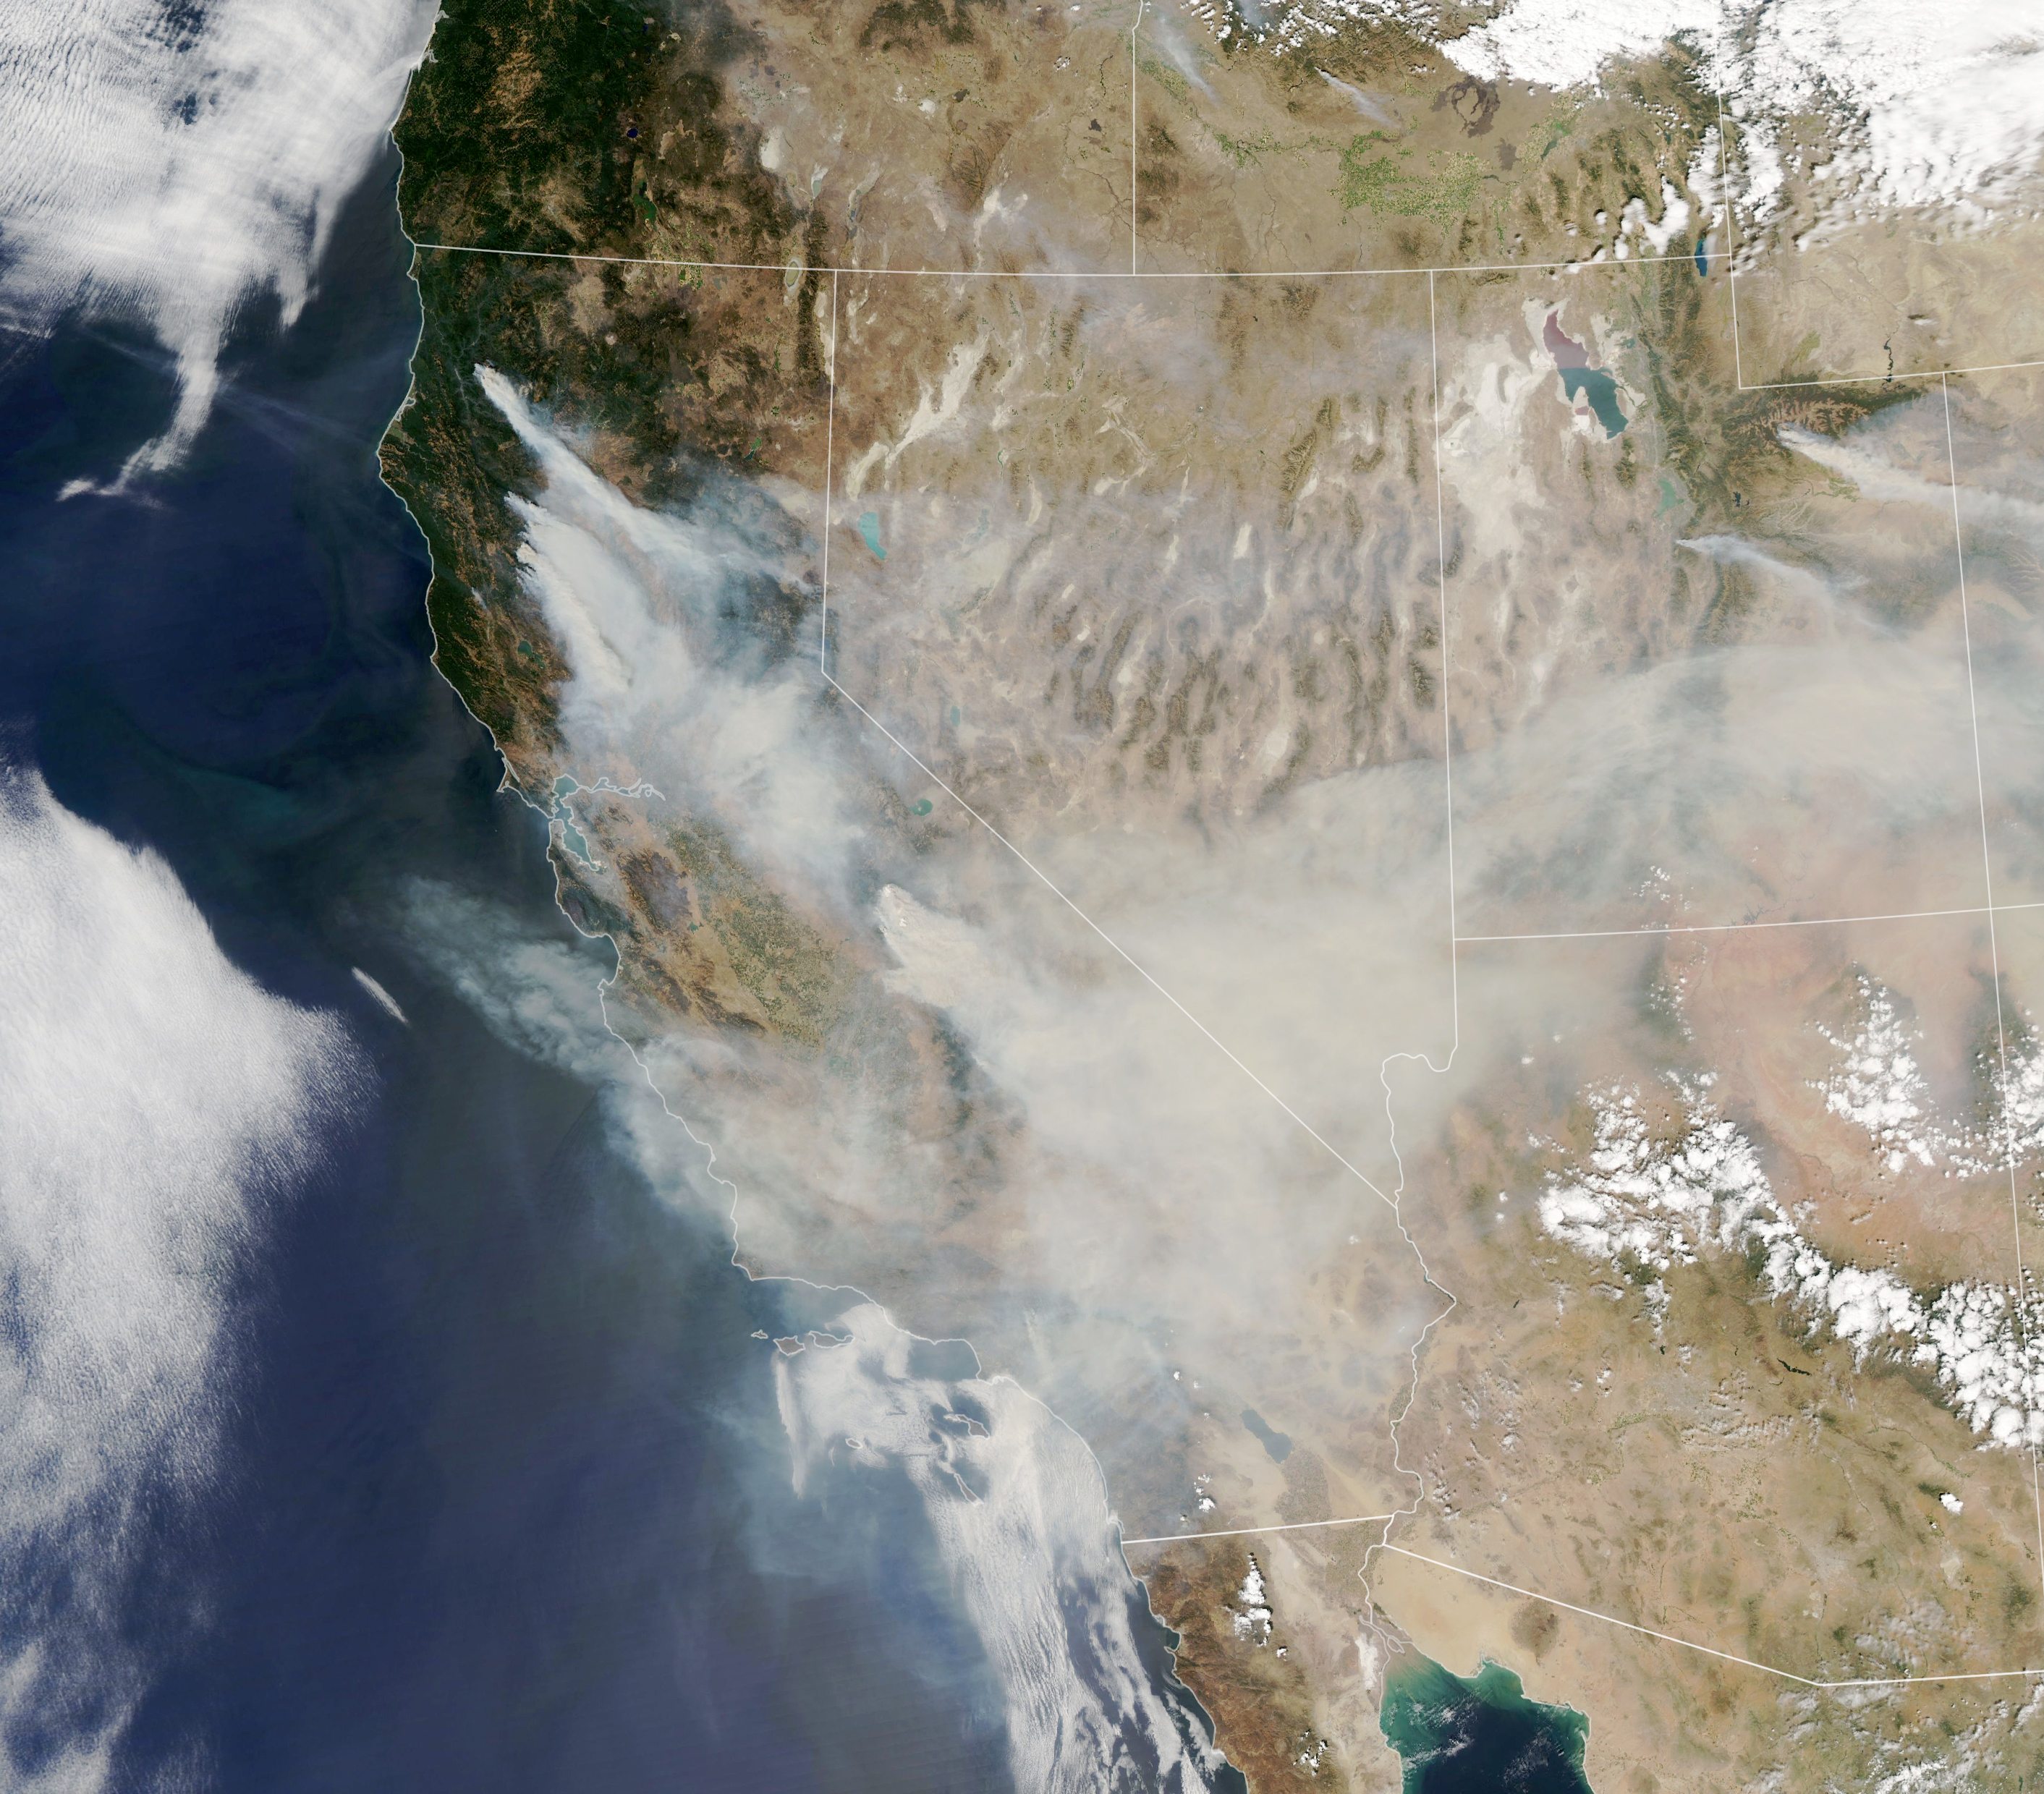
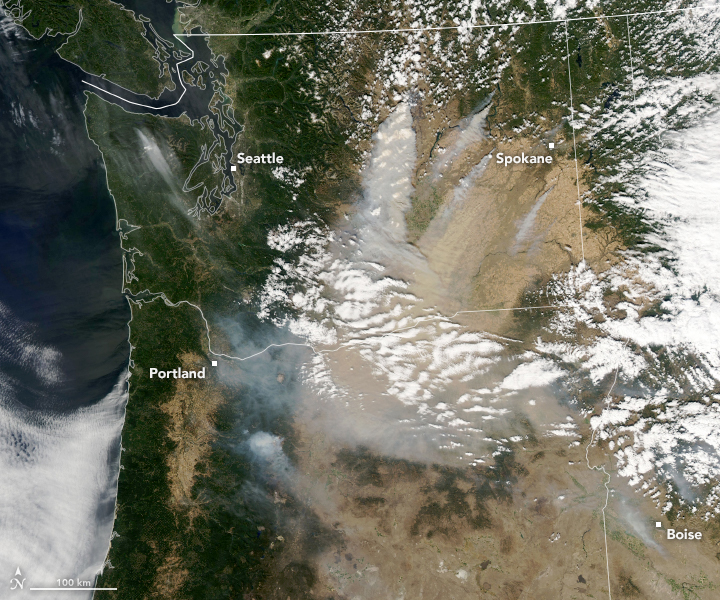
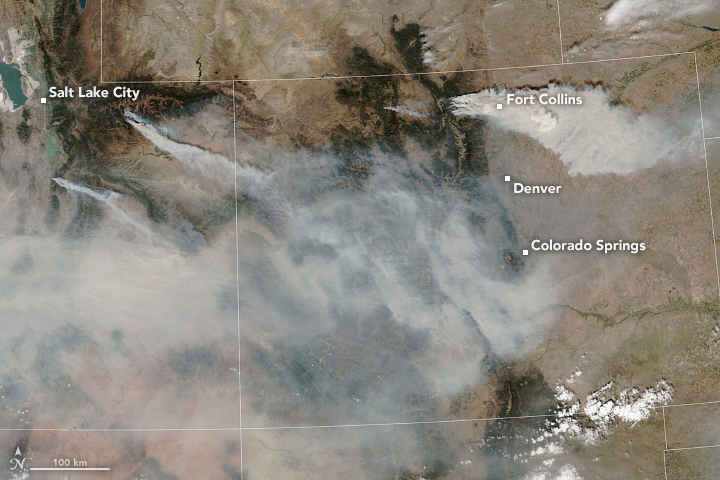
NASA's Earth Observatory also shared wildfire imagery taken over the Labor Day weekend, publishing a blog post with imagery of smoky plumes blanketing California. The instruments that captured these views fly aboard NASA's Aqua satellite and the NOAA-20 satellite.
These images also highlight the other western states experiencing bursts of wildfires. Officials with NASA's Earth Observatory detailed how the onset of strong winds over the weekend fueled the ''surge of intensity'' in the fires.
''With record-breaking heat and extreme drought conditions already gripping much of the region, the addition of high winds further energized the fires, prompting many to spread rapidly and loft vast columns of smoke high into the air,'' according to the NASA Earth Observatory blog post.
There are several resources available to people wanting to stay updated about the wildfires and their effects. California state officials are offering daily updates about the wildfires. The San Francisco Chronicle has created an Air Quality Map resource, available online. And NASA's Worldview application is another tool, which offers space views of Earth.
Follow Doris Elin Urrutia on Twitter @salazar_elin. Follow us on Twitter @Spacedotcom and on Facebook.

Doris is a science journalist and Space.com contributor. She received a B.A. in Sociology and Communications at Fordham University in New York City. Her first work was published in collaboration with London Mining Network, where her love of science writing was born. Her passion for astronomy started as a kid when she helped her sister build a model solar system in the Bronx. She got her first shot at astronomy writing as a Space.com editorial intern and continues to write about all things cosmic for the website. Doris has also written about microscopic plant life for Scientific American’s website and about whale calls for their print magazine. She has also written about ancient humans for Inverse, with stories ranging from how to recreate Pompeii’s cuisine to how to map the Polynesian expansion through genomics. She currently shares her home with two rabbits. Follow her on twitter at @salazar_elin.
