
NASA Climate Satellite Takes First Pictures
NASA's new climate and weather observing satellite is settling in to its new orbit high above the Earth and running through its instruments to make sure they all check out. During this process, it sent back its first science data: an image of water vapor in the lower atmosphere.
The National Polar-orbiting Operational Environmental Satellite System Preparatory Project (NPP) carries five instruments that are aimed at improving day-to-day weather forecasting while extending the record of many long-term observations of Earth's climate. This record, which range from the ozone layer and land cover to atmospheric temperatures and ice cover, are critical for understanding and predicting changes in global climate.
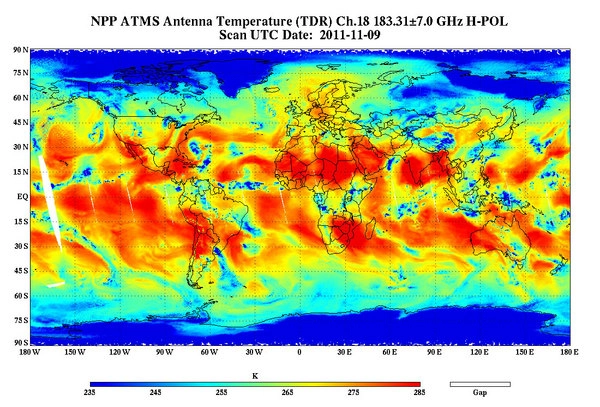
NPP's Advanced Technology Microwave Sounder (ATMS) took the water vapor measurements, on Nov. 8 in a range extending from Earth's surface up to 3 miles (5 kilometers). The image made from the data shows the variations in atmospheric water vapor across the globe, from areas with little water vapor (in red) to those with plenty of water in several forms, including clouds and rain (seen in blue). In the polar regions, the blue indicates the presence of snow and ice.
Tropical Storm Sean , which formed early last week, can be seen as a blue swirl over the Atlantic Ocean, just off the coast of the southeastern United States.
Water vapor is a key piece of the Earth's atmosphere , helping to drive its dynamics and playing a large role in weather. For example, moisture is a source of fuel for tropical storms and hurricanes.
"Water vapor is a fuel for weather formation and is the source for precipitation," said Fuzhong Weng, chief of the Satellite Climatology and Meteorology Division at the National Oceanic and Atmospheric Administration's Center for Satellite Applications and Research. "Water vapor distribution in space and time is a critical measurement for improving global weather forecasts. With detailed information in the vertical direction, forecasters can better identify the transport of water vapor associated with jet streams, which can fuel severe weather events. Computer forecast models can ingest the data through the analysis system and produce much better forecasts."
This story was provided by OurAmazingPlanet, a sister site to SPACE.com.