Integrating diverse satellite images sharpens our picture of activity on Earth (op-ed)
A new approach can help us get a clearer picture of what's happening on our home planet.

Amanda Ziemann is a remote sensing scientist at Los Alamos National Laboratory in New Mexico. She contributed this article to Space.com's Expert Voices: Op-Ed & Insights.
Being able to accurately detect changes to Earth's surface using satellite imagery can aid in everything from climate change research and farming to human migration patterns and nuclear nonproliferation. But until recently, it was impossible to flexibly integrate images from multiple types of sensors — for example, ones that show surface changes (such as new building construction) versus ones that show material changes (such as water to sand). Now, with a new algorithmic capability, we can — and in doing so, we get a more frequent and complete picture of what's happening on the ground.
At Los Alamos National Laboratory, we've developed a flexible mathematical approach to identify changes in satellite image pairs collected from different satellite modalities, or sensor types that use different sensing technologies, allowing for faster, more complete analysis. It's easy to assume that all satellite images are the same and, thus, comparing them is simple. But the reality is quite different. Hundreds of different imaging sensors are orbiting the Earth right now, and nearly all take pictures of the ground in a different way from the others.
Satellite quiz: How well do you know what's orbiting Earth?
Take, for example, multispectral imaging sensors. These are among the most common type of sensors and give us the images most of us think of when we hear "satellite imagery." Multispectral imaging sensors are alike in that they can capture color information beyond what the human eye can see, making them extremely sensitive to material changes. For example, they can clearly capture a grassy field that, a few weeks later, is replaced by synthetic turf.
But how they capture those changes varies widely from one multispectral sensor to the next. One might measure four different colors of light, for instance, while another measures six. Each sensor might measure the color red differently.
Add to this the fact that multispectral imaging sensors aren't the only satellite imaging modality. There is also synthetic aperture radar, or SAR, which captures radar images of Earth's surface structure at fine spatial resolution. These SAR images are sensitive to surface changes or deformation and are commonly used for applications such as volcano monitoring and geothermal energy. So, once again, we have an imaging sensor that is capturing information in a completely different way from another.
Breaking space news, the latest updates on rocket launches, skywatching events and more!
This is a real challenge when comparing these images. When signals come from two different remote sensing techniques, traditional approaches for detecting changes will fail because the underlying math and physics no longer make sense. But there's information to be had there, because these sensors are all imaging the same scenes, just in different ways. So how can you look at all of these images — multispectral images captured by different kinds of sensors and SAR images — in a way that automatically identifies changes over time?
Our mathematical approach makes this possible by creating a framework that not only compares images from different sensing modalities, but also effectively "normalizes" the different types of imagery — all while maintaining the original signal information.
But the most important benefit of this image integration is that we're able to see changes as frequent as minutes apart. Previously, the time elapsed between images captured by the same sensor could take days or weeks. But being able to integrate the images from various sensing modalities means that we're able to use data from more sensors faster, and thus see the changes more quickly, which allows for more rigorous analysis.
Related: The top 10 views of Earth from space

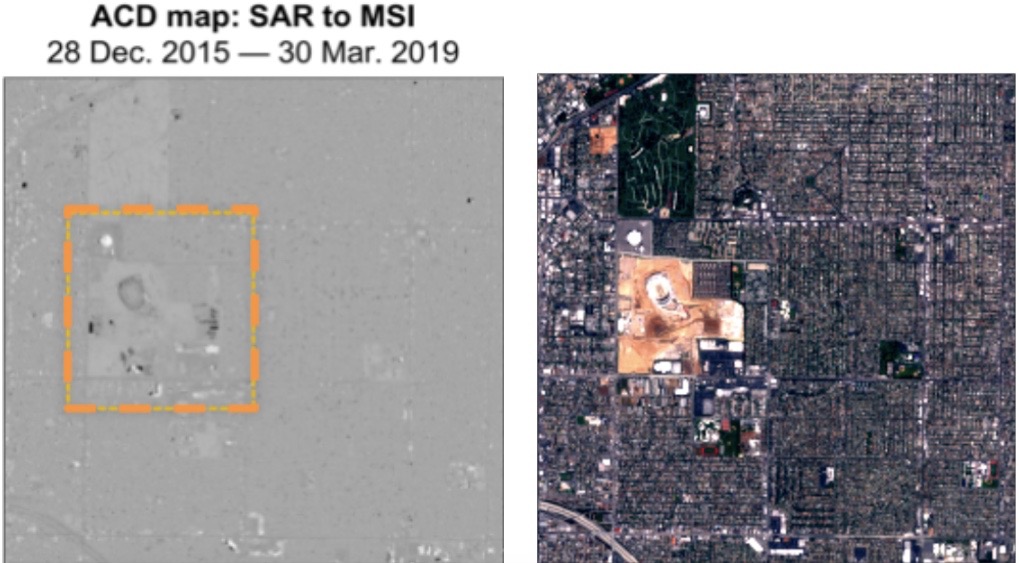
To test our method, we looked at images of the construction of the new SoFi stadium in Los Angeles starting in 2016. We began by comparing multispectral images from various multispectral sensors, as well as SAR images, over the same date range to see which modalities picked up which changes. For example, in one case, the roof of a building beside the stadium was replaced, changing it from beige to white over the course of several months. The multispectral imaging sensors detected this change, because it was related to color and material. SAR, however, did not, as we expected. However, SAR was highly sensitive to surface deformation due to moving dirt piles, whereas multispectral imagery was not.
When we integrated the images using our new algorithmic capability, we were able to see both changes — the surface and the material — at a much faster rate than if we focused on any one individual satellite. This had never been done before at scale, and it signals a potential fundamental shift in how satellite imagery is analyzed.
We were also able to demonstrate how changes could be detected much faster than before. In one instance, we were able to compare different multispectral images collected just 12 minutes apart. In fact, it was so fast, we were able to detect a plane flying through the scene.
As space-based remote sensing continues to become more accessible — particularly with the explosive use of cubesats and smallsats in both government and commercial sectors — more satellite imagery will become available. That's good news in theory, because it means more data to feed comprehensive analysis. In practice, however, this analysis is challenged by the overwhelming volume of data, the diversity in sensor designs and modalities, and the stove-piped nature of image repositories for different satellite providers. Furthermore, as image analysts become deluged with this tidal wave of imagery, the development of automated detection algorithms that "know where to look" is paramount.
This new approach to change detection won't solve all of those challenges, but it will help by optimizing the strengths of various satellite modalities — and give us more clarity about the changing landscape of our world in the process.
Follow us on Twitter @Spacedotcom or Facebook.
Follow all of the Expert Voices issues and debates — and become part of the discussion — on Facebook and Twitter. The views expressed are those of the author and do not necessarily reflect the views of the publisher.

Amanda Ziemann (ziemann@lanl.gov) received her B.S. and M.S. degrees in applied mathematics from the Rochester Institute of Technology (RIT), New York, in 2010 and 2011, respectively, and her Ph.D. in imaging science from RIT in 2015. She was an Agnew National Security Postdoctoral Fellow at Los Alamos National Laboratory (LANL), New Mexico, and is currently a staff scientist in the Space Data Science and Systems Group at LANL. She is a referee for several international journals. Her research interests include remote sensing, spectral imaging, signal detection, and data fusion.
