Earth barreling toward 'Hothouse' state not seen in 50 million years, epic new climate record shows

A climate map showing the last 66 million years of Earth's history
A climate map showing the last 66 million years of Earth's history (Image credit: Westerhold et al., CENOGRID)

Sixty-six million years ago, after a massive asteroid hit Earth with the explosive energy of roughly 1 billion nuclear bombs, a shroud of ash, dust and vaporized rock covered the sky and slowly rained down on the planet. As plant and animal species died en masse, tiny undersea amoebas called forams continued to reproduce, building sturdy shells out of calcium and other deep-sea minerals, just as they had for hundreds of millions of years. When each foram inevitably died — pulverized into seabed sediment — they kept a little piece of Earth's ancient history alive in their fossilized shells.

For decades, scientists have studied those shells, finding clues about the ancient Earth's ocean temperatures, its carbon budget and the composition of minerals spilling through the air and seas. Now, in a new study published today (Sept. 10) in the journal Science, researchers have analyzed the chemical elements in thousands of foram samples to build the most detailed climate record of Earth ever — and it reveals just how dire our current climate situation is. 

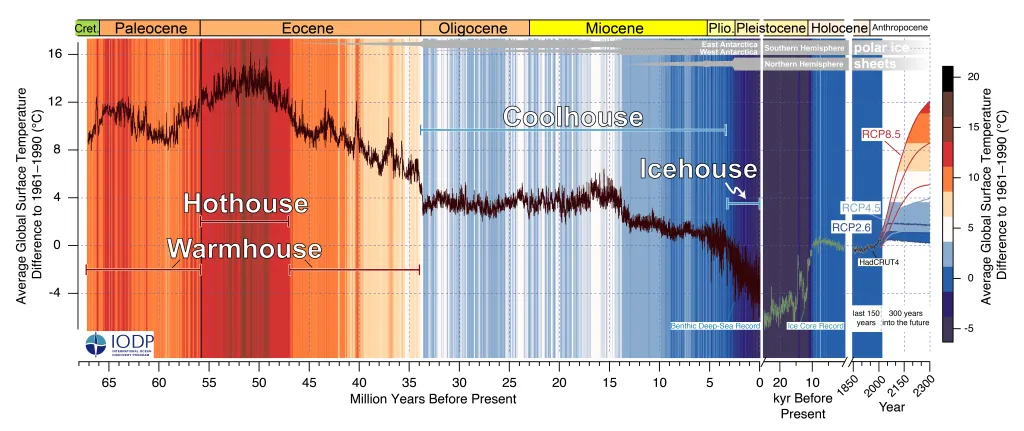
The new paper, which comprises decades of deep-ocean drilling missions into a single record, details Earth's climate swings across the entire Cenozoic era — the 66 million-year period that began with the death of the dinosaurs and extends to the present epoch of human-induced climate change. The results show how Earth transitioned through four distinct climate states — dubbed the Warmhouse, Hothouse, Coolhouse and Icehouse states — in response to changes in the planet's orbit, greenhouse gas levels and the extent of polar ice sheets.

Related: 10 Signs Earth's climate is off the rails

The zig-zagging chart (shown above) ends with a sobering peak. According to the researchers, the current pace of anthropogenic global warming far exceeds the natural climate fluctuations seen at any other point in the Cenozoic era, and has the potential to hyper-drive our planet out of a long icehouse phase into a searing hothouse state.

"Now that we have succeeded in capturing the natural climate variability, we can see that the projected anthropogenic warming will be much greater than that," study co-author James Zachos, professor of Earth and planetary sciences at the University of California, Santa Cruz, said in a statement. "The Intergovernmental Panel on Climate Change (IPCC) projections for 2300 in the 'business-as-usual' scenario will potentially bring global temperature to a level the planet has not seen in 50 million years." (The IPCC is a United Nations group that assesses the science, risks and impacts of climate change on the planet.)

The JOIDES Resolution Drillship gathered sediment cores for the new study.

The JOIDES Resolution Drillship gathered ocean sediment cores for the new study. (Image credit: Adam Kurtz)

Into the hothouse

To compile their new era-long climate map, the study authors examined fossil foram shells in deep-sea sediment cores — long tubes of rock, sediment and microbes — drilled from the world's oceans over the past several decades. Forams (short for foraminifera) are microscopic plankton whose oldest relatives appeared in the ocean close to a billion years ago; the deeper scientists dig into the seabed, the older the foram specimens they uncover. 

The ratios of carbon and oxygen isotopes (versions of elements) in foram shells hold critical climate information. The ratio between the oxygen isotopes oxygen-18 and oxygen-16, for example, can reveal how warm the surrounding water was when a foram constructed its shell; the higher the ratio, the colder the water. The ratio between carbon-13 and carbon-12 shows how much organic carbon was available for the microbes to eat; here, a higher ratio correlates with more greenhouse gases (like carbon dioxide) in the atmosphere.

Because the team's climate record covers such an incredibly long time period, the researchers also had to consider astronomic impacts on the planet's climate — that is, how Earth's slowly changing orbit and tilt toward the sun impact the amount of sunlight reaching different parts of the planet at different times, also known as Milankovitch cycles. When the team overlaid orbital data with their isotopic climate data, they saw that orbital variations created distinct but relatively small-scale changes to the global climate. Crucially, each big jump between climate states was tied to a massive shift in greenhouse gas levels, the researchers said.

A climate map showing the last 66 million years of Earth's history (and the next 300). (Image credit: Westerhold et al., CENOGRID)

For example, about 10 million years after the dinosaur extinction, Earth jumped from a warmhouse state to a hothouse state. This event, known as the Paleocene-Eocene Thermal Maximum, saw temperatures up to 29 degrees Fahrenheit (16 degrees Celsius) above modern levels, Zachos said, and was driven by a massive release of carbon into the atmosphere, thought to be the result of huge volcanic eruptions in the North Atlantic. Similarly, as carbon dioxide disappeared from the atmosphere over the next 20 million years, ice sheets started to form in Antarctica and the planet entered a coolhouse phase, with surface temperatures averaging about 7 F (4 C) above modern levels.

Related: 10 ways the Earth changed forever in 2019

About 3 million years ago, Earth entered an icehouse phase, driven by waxing and waning ice sheets in the Northern Hemisphere. Now, human greenhouse gas emissions are causing temperatures to rise to an extent not seen in tens of millions of years. This rise is well beyond the natural variations triggered by Earth's changing orbit, the researchers concluded. And if current greenhouse emissions hold steady, the climate could skyrocket back to levels not seen since the Paleocene-Eocene Thermal Maximum. The transition from icehouse to hothouse won't take millions of years, Zachos said — it will take hundreds.

"We now know more accurately when it was warmer or colder on the planet and have a better understanding of the underlying dynamics and the processes that drive them," lead study author Thomas Westerhold, Director of the University of Bremen Center for Marine Environmental Sciences in Germany, said in the statement. "The time from 66 [million] to 34 million years ago, when the planet was significantly warmer than it is today, is of particular interest, as it represents a parallel in the past to what future anthropogenic change could lead to."

Editor's Note: This story was updated on Sept. 11 to fix two Celsius and Fahrenheit conversions.

Originally published on Live Science.

Join our Space Forums to keep talking space on the latest missions, night sky and more! And if you have a news tip, correction or comment, let us know at: community@space.com.

Brandon Specktor
LiveScience senior writer

Brandon has been a senior writer at Live Science since 2017, and was formerly a staff writer and editor at Reader's Digest magazine. His writing has appeared in The Washington Post, CBS.com, the Richard Dawkins Foundation website and other outlets. He holds a bachelor's degree in creative writing from the University of Arizona, with minors in journalism and media arts. He enjoys writing most about space, geoscience and the mysteries of the universe.

  • ChumpChange
    First, global warming is what happens between ice ages. This is a fact, whether humans are on the planet or not. The data on the graph is exaggerated by 4,900%, which I'll get to at the end. Second, historic atmospheric CO2 level increases have very often not correlated with increases in atmospheric temperatures. Assuming a linear increase in atmospheric CO2 levels it looks like we might be close to reaching where C02 was 30 or 40 million years ago in the next one or two centuries, but associating that with a "hothouse" is a specious argument. Please also note that current CO2 levels are near planetary minimums over the last 500 million years. Third, we know that Antarctica has been ice-free over 60 times, the last big melt being just over one million years ago. Between glaciation cycles, which do not always occur with ice ages, sea levels rise and fall up to 200 meters (600 feet), and this is consistent with what we are seeing now, which is a 300 foot rise in sea levels since the end of the last ice age approximately 12,000 years ago. It is entirely possible and consistent with geological history that Manhattan and Florida will be under several hundred feet of sea water again, as they have been many times in the past before humans walked the earth. On this point, lots is being made about the Antarctic ice sheet breaking off and raising ocean levels. Let's be clear, the ice sheet is already floating on the ocean, so its melting isn't going to raise ocean levels one inch. Ignoring the facts for the hype is journalistic and scientific malfeasance. When Greenland and the Antarctic land mass are ice-free, that will raise ocean levels as it has many times in Earth's geologic history. Fourth, long before humans arrived on the scene CO2 levels were much higher, and current land temperatures and deep ocean temperatures are the coldest they've been in 500,000 years and 65 million years, respectively. Finally, and most damning for the "hothouse" graph is that they commit scale exaggeration of 4,900% to scare the math illiterate. To be clear, the graph changes scale from tens of thousands of years to hundreds of years at the far right of the X-axis. Specifically, it changes from 15,000 years to 300 years to falsely magnify short-term trends in atmospheric temperature, which are largely driven by La-Nina and El-Nino driving short-term ocean temperature changes. This is journalistic and scientific game playing to push a pre-determined conclusion.
    Reply
  • Megavolt
    https://wattsupwiththat.com/2010/03/08/the-logarithmic-effect-of-carbon-dioxide/
    The effect of co2 is exaggerated by the scientifically illiterate.
    Reply
  • Erny_Module
    ChumpChange said:
    First, global warming is what happens between ice ages. This is a fact, .... edited for brevity.
    Quite so. Atmospheric CO2 levels do not predict or drive global temperatures over geological timespans, in fact, there seems to be little, if any, correlation. The sensitivity to CO2, or 'Forcing', in all the models is way, way too high, and so they generate runaway temperatures. Compare temperatures predicted by the models with observations, and you'll see they all run too hot - much hotter than what is observed. This may be by accident or design, but the models are not, and cannot be accurate - especially when trying to forecast temperatures out to 300 years in the future! They are still unable to handle clouds properly! The models are basically trying to forecast the future state of two interacting turbulent fluids - the atmosphere and the oceans. Good luck with that. Go talk to an aerodynamicist and ask them what they like about turbulence.
    The Earth is warming, gradually, as expected - there's no debate about that. The debate is as to what effect, if any, man-made CO2 is having, and that, despite what anyone might say, is by no means settled.
    I would like to see that graph properly plotted - I suspect you'd need a very large magnifying glass to see that last part that they're getting all worked up about.
    Reply
  • Andrew LB
    The big problem with climate models is that ironically they do not account for the atmosphere being spherical.

    I'm not joking here, this is indeed the case. The implications of this are profound. I would recommend giving this paper a read.

    A round Earth for climate models
    View ORCID ProfileMichael J. Prather and View ORCID ProfileJuno C. Hsu

    SignificanceEarly climate and weather models, constrained by computing resources, made numerical approximations on modeling the real world. One process, the radiative transfer of sunlight through the atmosphere, has always been a costly component. As computational ability expanded, these models added resolution, processes, and numerical methods to reduce errors and become the Earth system models that we use today. While many of the original approximations have since been improved, one—that the Earth’s surface and atmosphere are locally flat—remains in current models. Correcting from flat to spherical atmospheres leads to regionally differential solar heating at rates comparable to the climate forcing by greenhouse gases and aerosols. In addition, spherical atmospheres change how we evaluate the aerosol direct radiative forcing.
    AbstractSunlight drives the Earth’s weather, climate, chemistry, and biosphere. Recent efforts to improve solar heating codes in climate models focused on more accurate treatment of the absorption spectrum or fractional clouds. A mostly forgotten assumption in climate models is that of a flat Earth atmosphere. Spherical atmospheres intercept 2.5 W⋅m−2 more sunlight and heat the climate by an additional 1.5 W⋅m−2 globally. Such a systematic shift, being comparable to the radiative forcing change from preindustrial to present, is likely to produce a discernible climate shift that would alter a model’s skill in simulating current climate. Regional heating errors, particularly at high latitudes, are several times larger. Unlike flat atmospheres, constituents in a spherical atmosphere, such as clouds and aerosols, alter the total amount of energy received by the Earth. To calculate the net cooling of aerosols in a spherical framework, one must count the increases in both incident and reflected sunlight, thus reducing the aerosol effect by 10 to 14% relative to using just the increase in reflected. Simple fixes to the current flat Earth climate models can correct much of this oversight, although some inconsistencies will remain.
    https://www.pnas.org/content/116/39/19330
    For the past decade i watched arrogant people in academia and pompus keyboard commandos attack anyone who would dare question the climate change orthodoxy, typically calling them anti-science or my favorite, Flat-Earthers. The irony is so thick it would make a pr0n star blush.

    (account is new because i can't access my old one for some reason)
    Reply
  • Jan Steinman
    Nothing like having "climate" in the title to make the KochBots bring in the naysayers.

    You might disagree with long-term predictions, but it's hard to disregard recent climactic events, like exceptional storms, hundred-year floods every five years or so, and the widespread incineration of forests.

    Among having done many other things (including a STEM career) I am now an organic farmer. Our growing season has increased year over year for a decade. Our pear trees are blooming three weeks earlier, on average, than they did 13 years ago.

    But the naysayers will explain that away somehow.
    Reply