


With its dense atmosphere, Saturn’s largest moon, Titan, is a world overflowing with secrets — but new composite images could reveal some of the hidden features of this still-mysterious moon.
Conventional photo surveys might not be able to penetrate Titan's dense haze, but the Visual and Infrared Mapping Spectrometer (VIMS) on board NASA’s Cassini spacecraft is one of the few instruments that can see through it to probe the surface below.
Now, researchers are pulling together 12 years’ worth of VIMS data to create the detailed and global maps shown above.
Cassini has flown past Titan roughly once a month since it arrived in Saturn's system in 2004, and it has collected more than 100 photos of the moon's surface. But despite that wealth of information, the task of creating a global map is still a challenging one, NASA officials said in a statement. Observing conditions change with each flyby, including variations in the angle of the sun, the spacecraft’s viewing direction and the season. These changes affect how bright different areas of the surface appear, which makes it difficult for researchers to stitch together the images into a seamless composite. To date, none of their solutions has been perfect. [Amazing Photos of Titan, Saturn's Largest Moon]
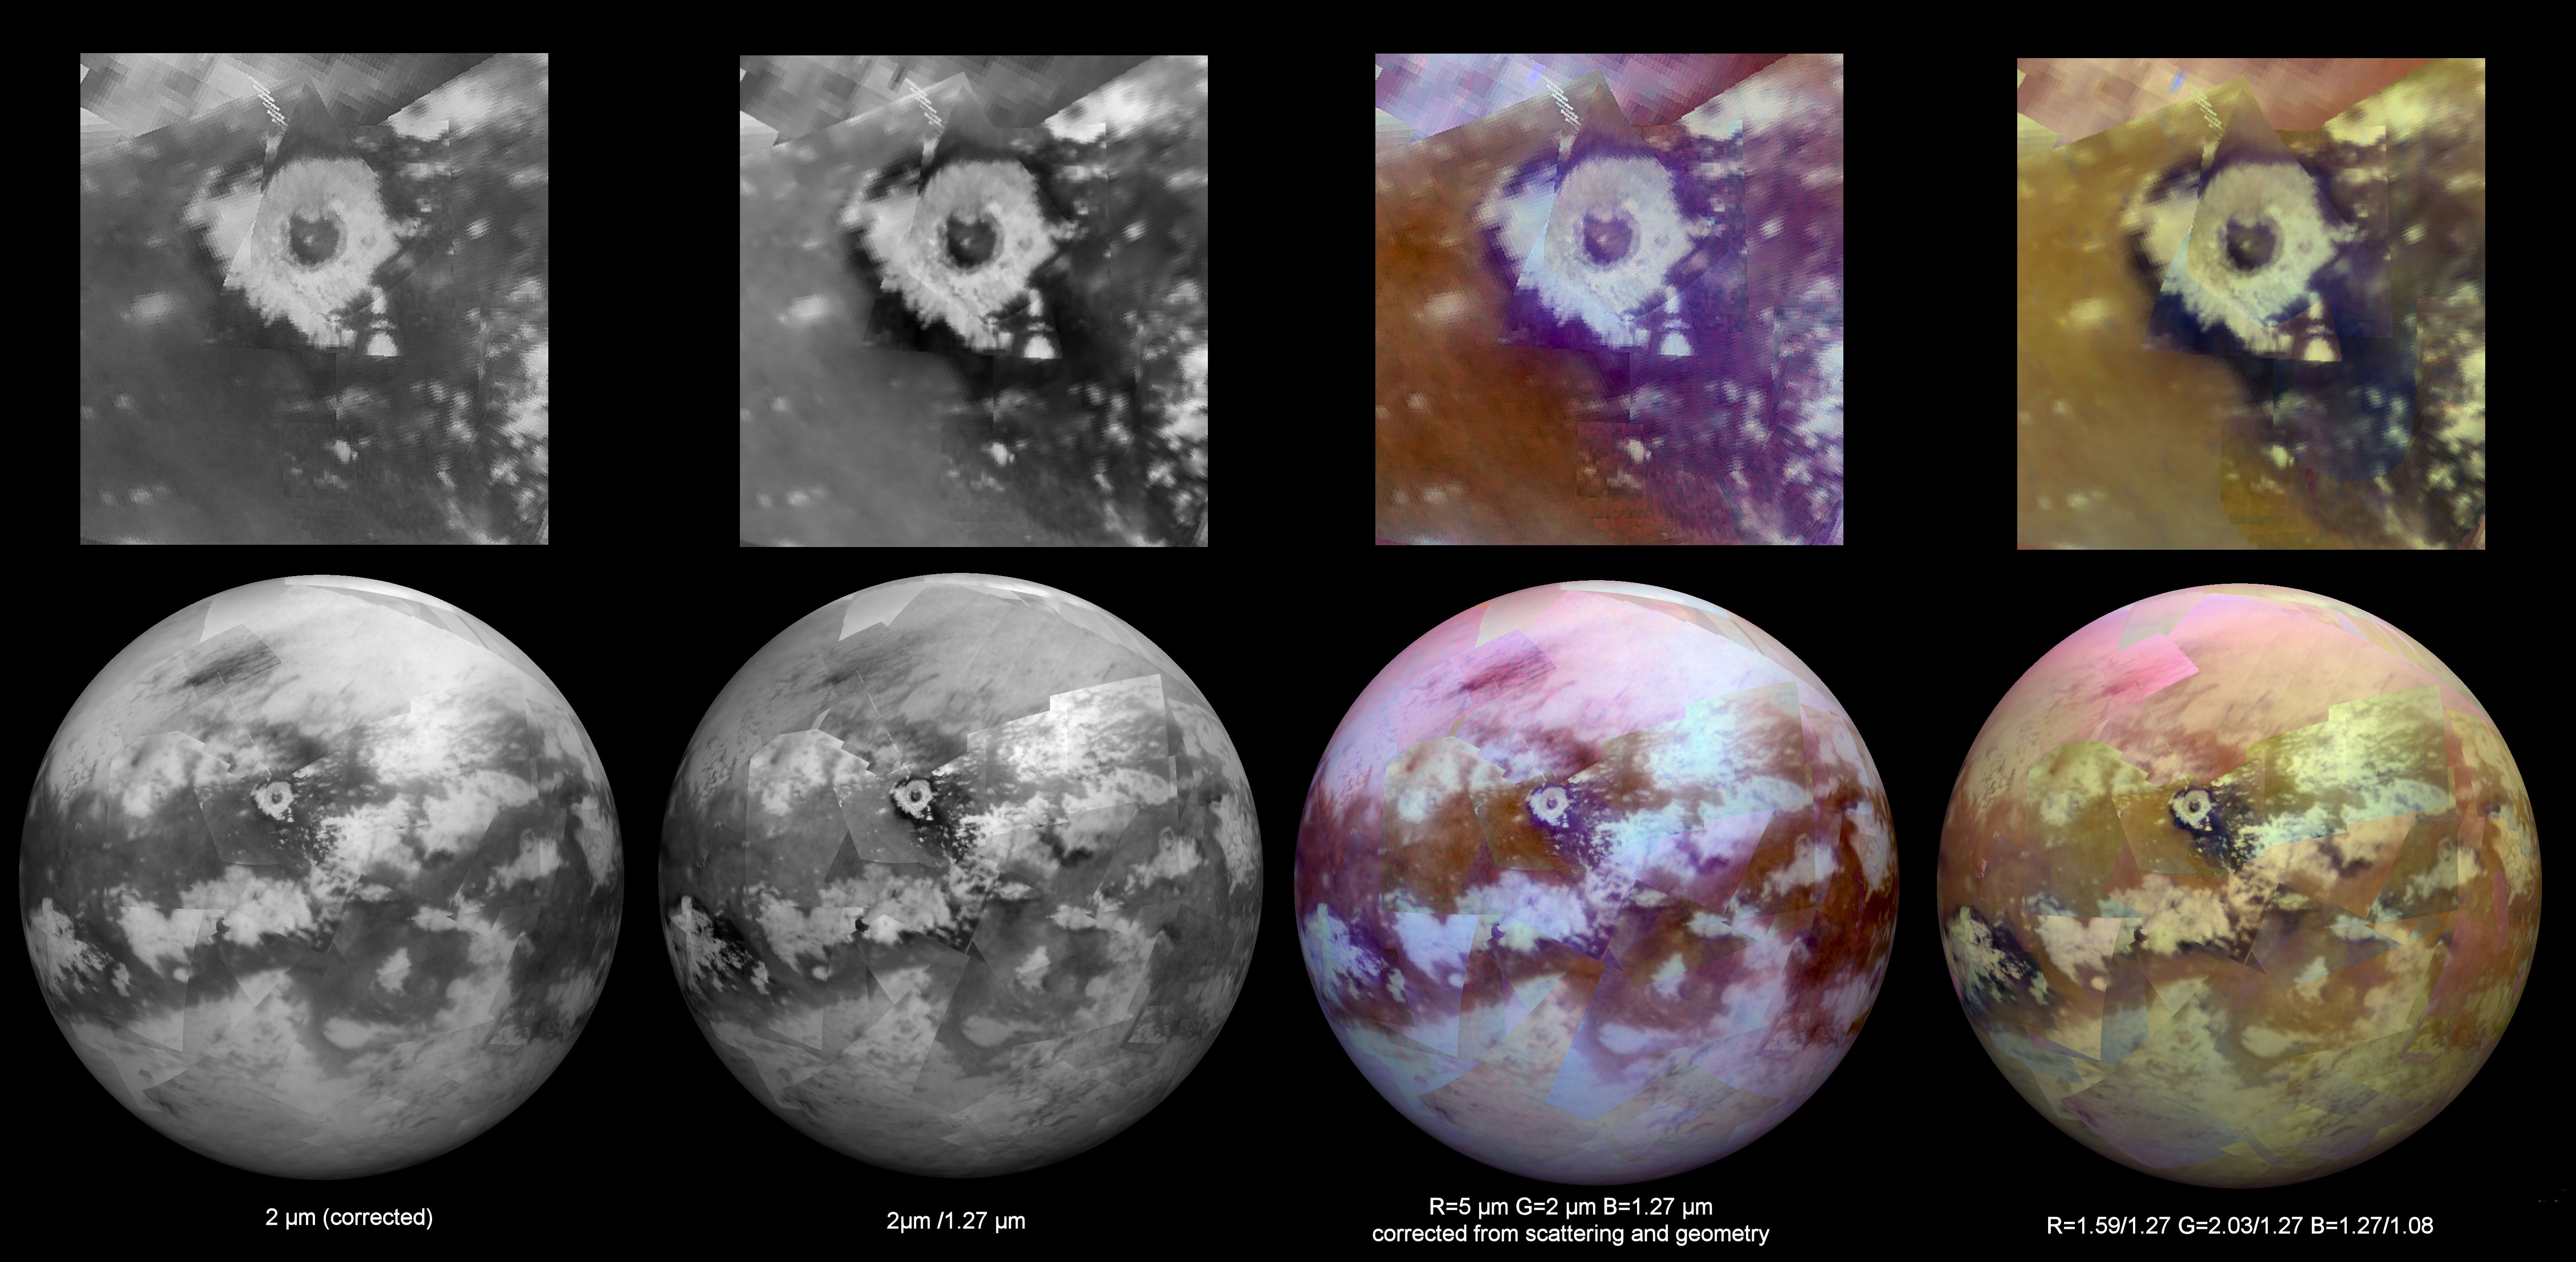
Still, the maps above show the composites' potential. The upper row of images displays the 50-mile-wide (80 km) Sinlap impact crater — one of the youngest impact craters to dot Titan's surface — and the lower row of images features the entire hemisphere where that crater is located. Each is made from a combination of VIMS infrared photographs.
The first column of images (far left) shows the surface at 2 microns, or infrared light. For the second column, researchers divided an image at one infrared wavelength by an image at another infrared wavelength to bring out additional features, creating what are called spectral ratio images. The third column is a color composite that combines images at 5 microns shown in red, 2 microns in green and 1.27 microns in blue, and the final (rightmost) column are color composites created using spectral-ratio images.
The spectral-ratio images have a particular flair for revealing subtle differences in the nature of surface materials. But all the new images will likely reveal unprecedented details of the hazy moon’s secrets.
Follow Shannon Hall on Twitter @ShannonWHall. Follow us @Spacedotcom, Facebook and Google+. Original article on Space.com.
