Satellites Go with the Flow in This Amazingly Accurate Map of Antarctica's Ice
The map relied on 25 years of data.

Antarctica's ice sheets are on the move, and now scientists have the clearest picture yet of exactly where all the ice is going.
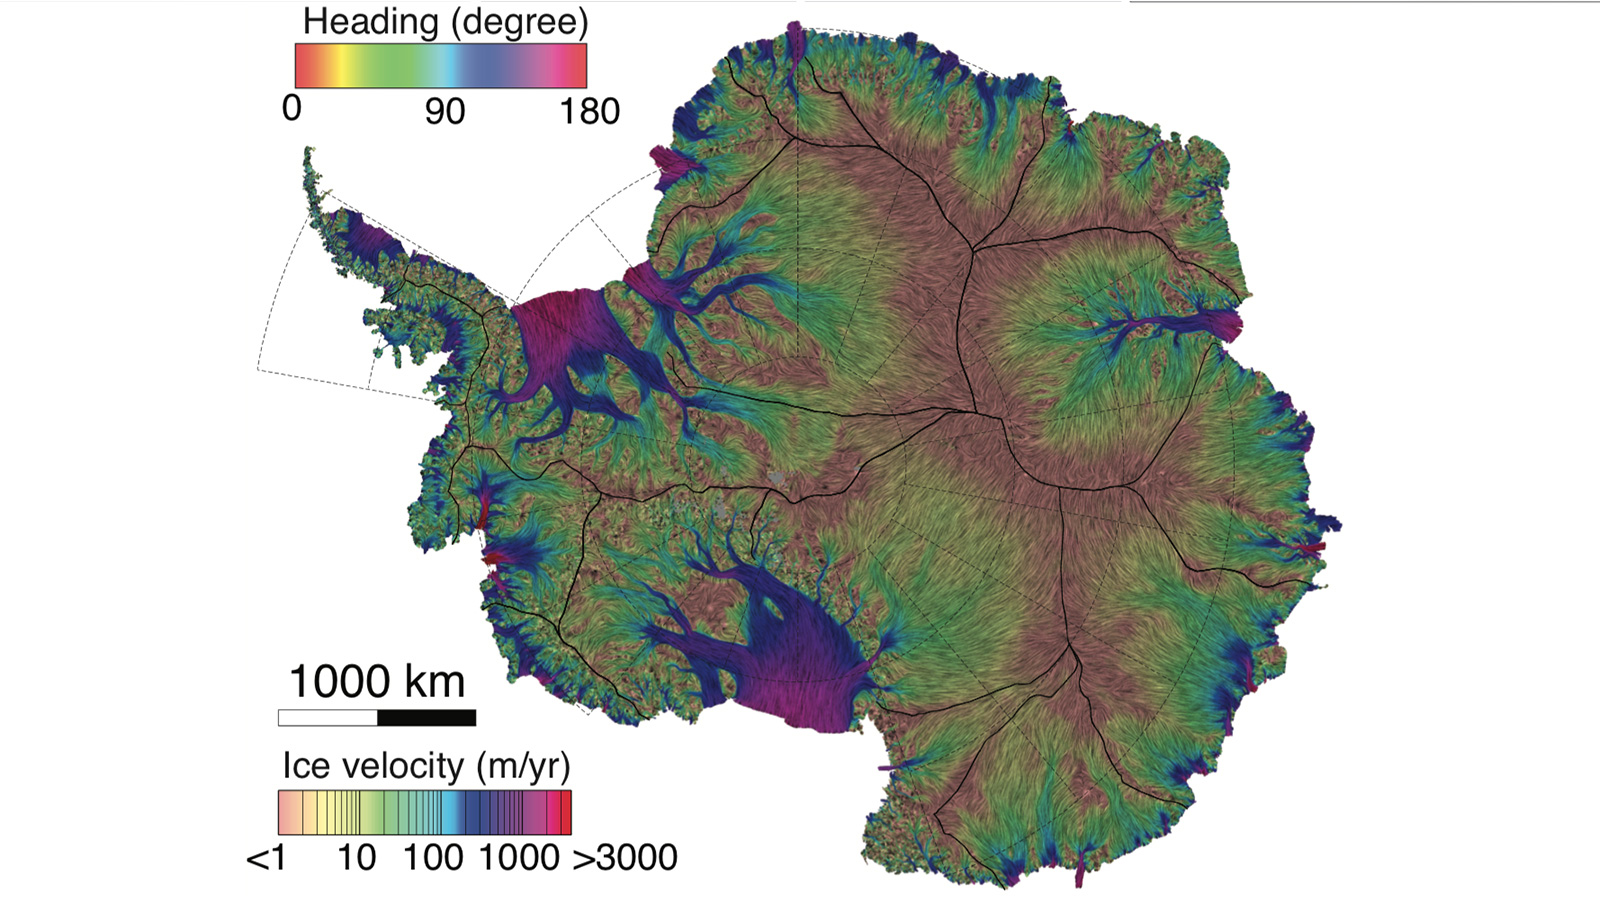
Data collected from six satellites over the course of 25 years was used to create the most accurate map of ice velocity in Antarctica, shedding light on the effects of climate change on glaciers for the continent.
Glaciologists from the University of California, Irvine (UCI) and NASA's Jet Propulsion Laboratory (JPL) in Pasadena, California, put together the map, which is 10 times more accurate than any other visualization of ice glacier movements to date. It maps how ice has flowed over about 80% of the continent, compared with just 20% in older maps.
The map showed ice movement in over 70% of Antarctica, with ice-sheet movement in the interior region of the continent being mapped with high precision for the first time, according to a statement by UCI.
Related: How NASA Data Helps Us Deal With Disasters and Climate Change
"This more detailed representation will help improve our understanding of ice behavior under climate stress over a larger part of the continent, farther south, and will enable improved projections of sea level rise through numerical models,"Jeremie Mouginot, lead author of the study and a UCI associate researcher in Earth system science, said in the statement.
The team of scientists relied on data from six Earth observation satellites from space agencies around the world, including the Canadian Space Agency's Radarsat-1, two European Remote Sensing (ERS) satellites and the Japan Aerospace Exploration Agency's Advanced Land Observation Satellite.
Breaking space news, the latest updates on rocket launches, skywatching events and more!
However, the scientists note that there has been more data from satellites in the past decade as more resources were deployed in Earth's orbit.
Previous maps of ice movements relied on tracking the motion of visible features such as patches of dirt on the surface of the ice. However, this map used a technique called synthetic aperture radar interferometry, which tracks the slightest movement by measuring radar signals that reflect off the ice itself, according to a statement by JPL.
"This product will help climate scientists achieve a number of goals, such as a better determination of the boundaries between glaciers and a thorough evaluation of regional atmospheric climate models over the entire continent," Eric Rignot, co-author of the study, said in the statement. Rignot is also chair and professor of Earth System Science at UCI and a JPL senior research scientist.
The map can also help scientists locate the best sites for ice- core drilling, the process of taking measurements and retrieving samples from underneath the surface of the ice to conduct further studies, Rignot added.
The results of this study were published July 29 in Geophysical Research Letters.
- Here's How Scientists Tracked That Arctic Fox's Epic Journey
- The Heart of Climate Change: New ESA Image Shows 'Island Love' Under Threat
- Giant Void Hidden Under Antarctica's Ice Threatens Vast Glacier
Follow Passant Rabie on Twitter @passantrabie. Follow us on Twitter @Spacedotcom and on Facebook.

Passant Rabie is an award-winning journalist from Cairo, Egypt. Rabie moved to New York to pursue a master's degree in science journalism at New York University. She developed a strong passion for all things space, and guiding readers through the mysteries of the local universe. Rabie covers ongoing missions to distant planets and beyond, and breaks down recent discoveries in the world of astrophysics and the latest in ongoing space news. Prior to moving to New York, she spent years writing for independent media outlets across the Middle East and aims to produce accurate coverage of science stories within a regional context.
