Secrets of Sun Super-Tornadoes Revealed (Gallery)
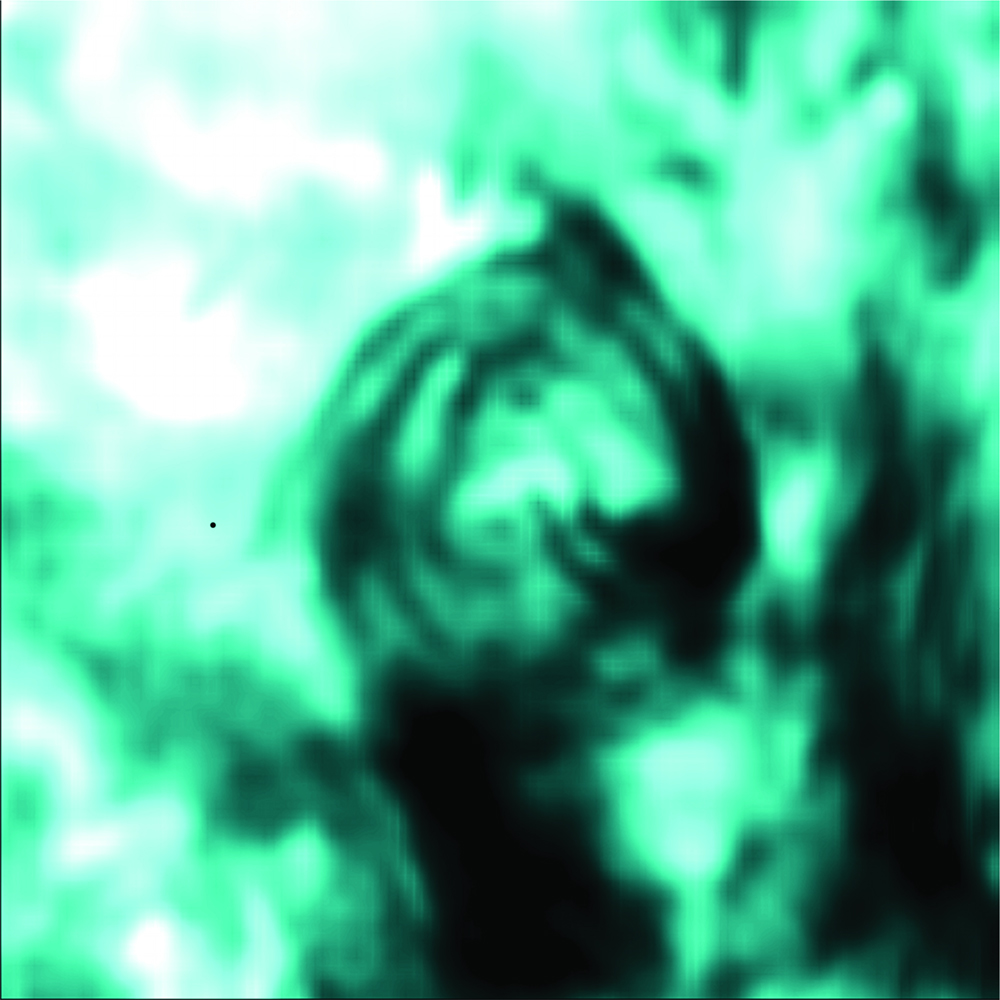
Observational Signature of a Magnetic Tornado
Intensity image recorded with the Swedish 1-m Solar Telescope in the line core of the spectral line of singly ionised calcium (infrared triplet, wavelength 854.2 nm). The detected chromospheric swirl (dark ring) is the observational signature of a magnetic tornado. Image released June 27, 2012.
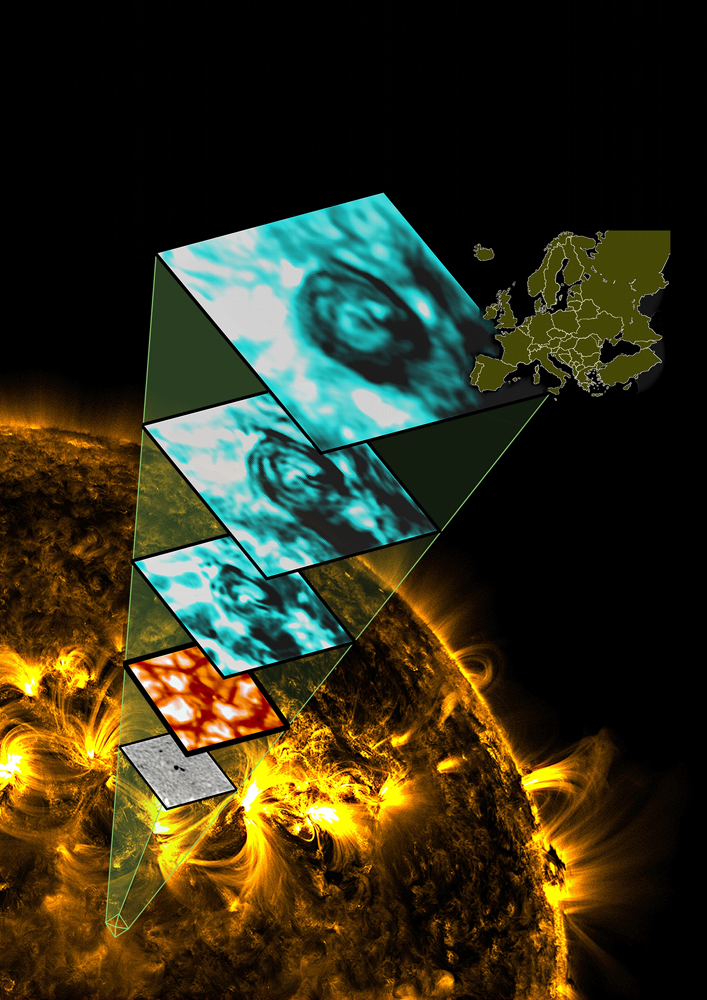
Illustration of an Observed Magnetic Tornado Vortex
Illustration of an observed magnetic tornado vortex in the solar atmosphere. The background image was recorded with NASA's Solar Dynamics Observatory, while the stacked images were obtained with the Swedish 1-m Solar Telescope (Canary Isl.). The bluish images reveal the swirl signature of a magnetic tornado. We include a map of Europe to scale. Image released June 27, 2012.
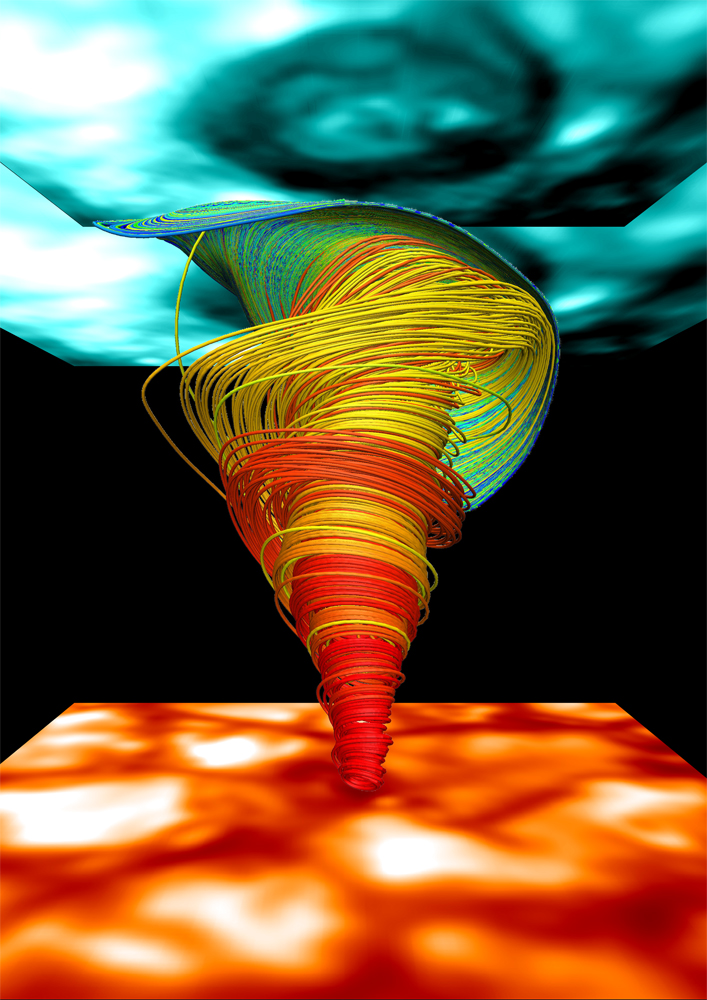
3D Numerical Simulations of a Magnetic Tornado
Visualisation of a close-up region in our advanced 3D numerical simulations of a magnetic tornado in the solar atmosphere. The spiral lines represent the velocity field in the tornado vortex. The images contain the observed swirl signature (top, bluish) and the Sun's surface (bottom, reddish). Image released June 27, 2012.
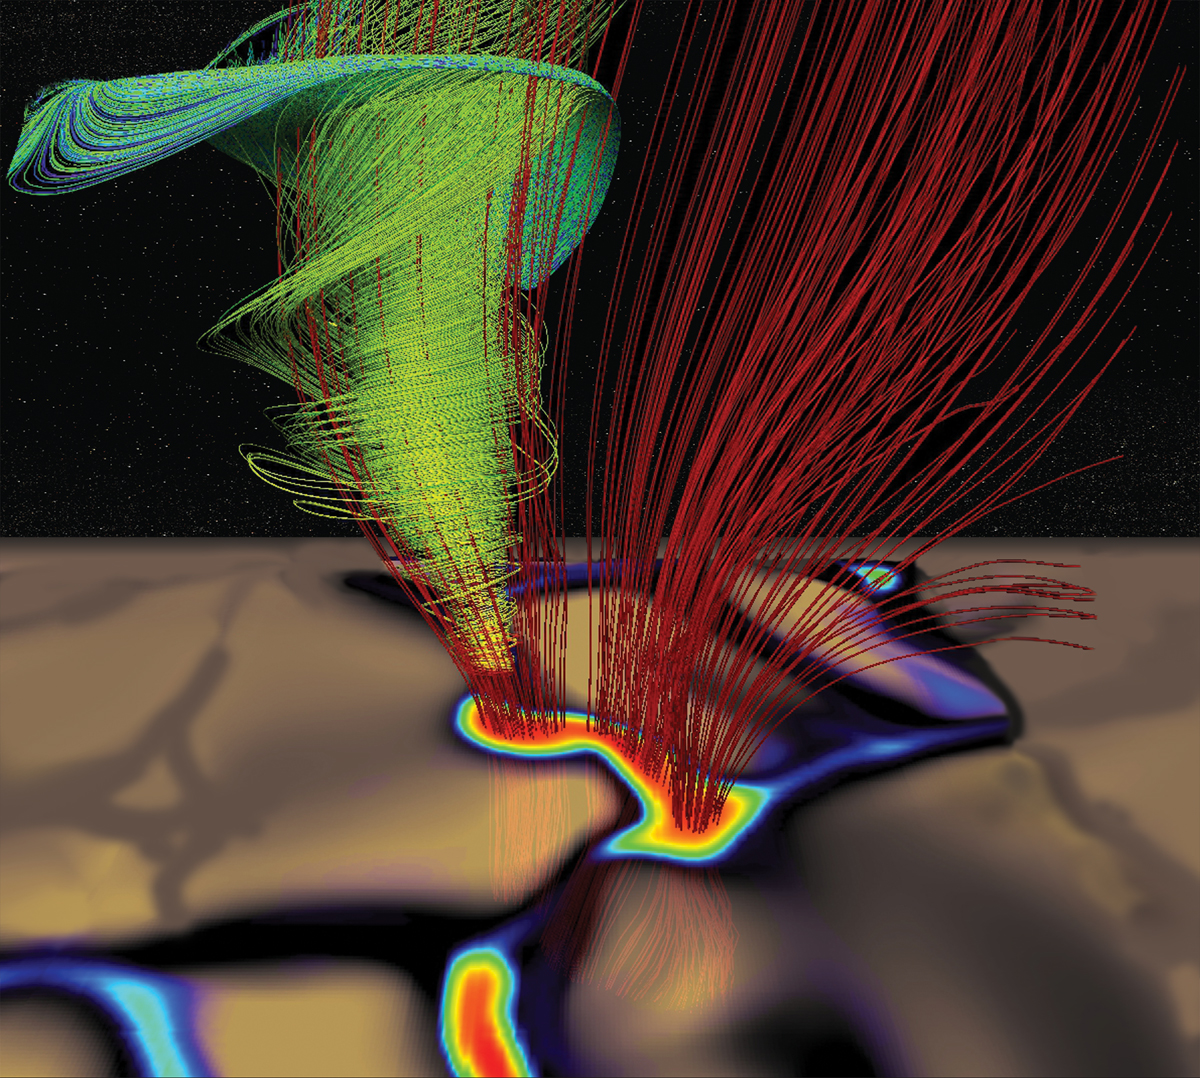
Close-Up Region in a Magnetic Tornado
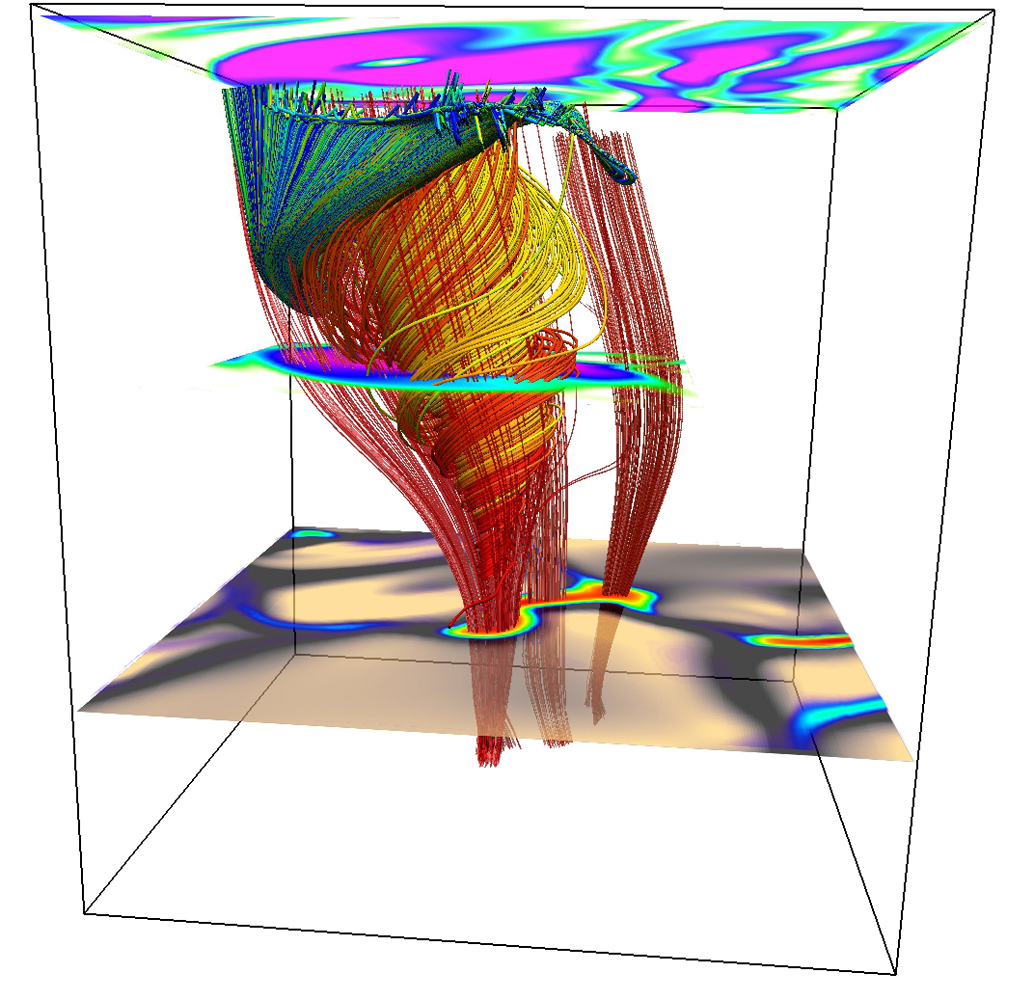
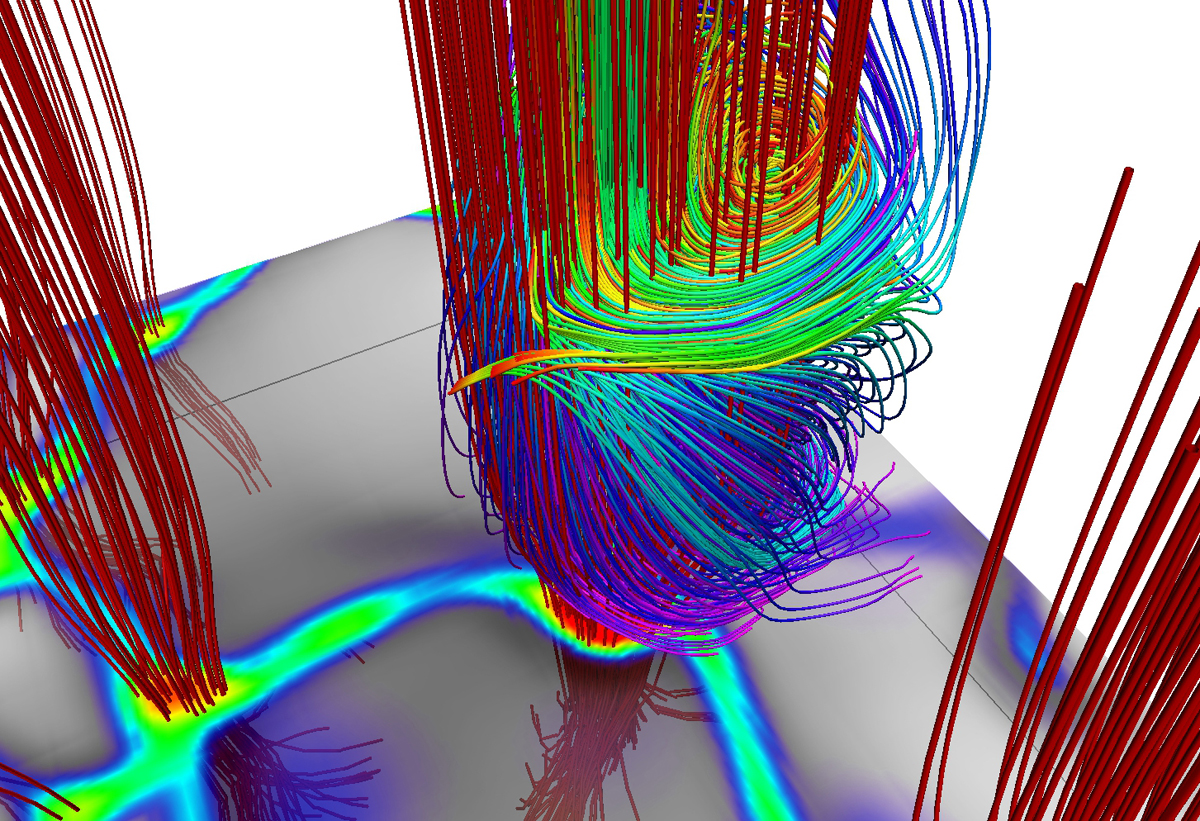
Visualisation of a close-up region in our advanced 3D numerical simulations of a magnetic tornado in the solar atmosphere. The green lines represent the velocity field in the tornado vortex, the red lines represent the magnetic field. The simulated Sun surface is in grey-scale. Image released June 27, 2012.
Schematic View of Magnetic Tornado
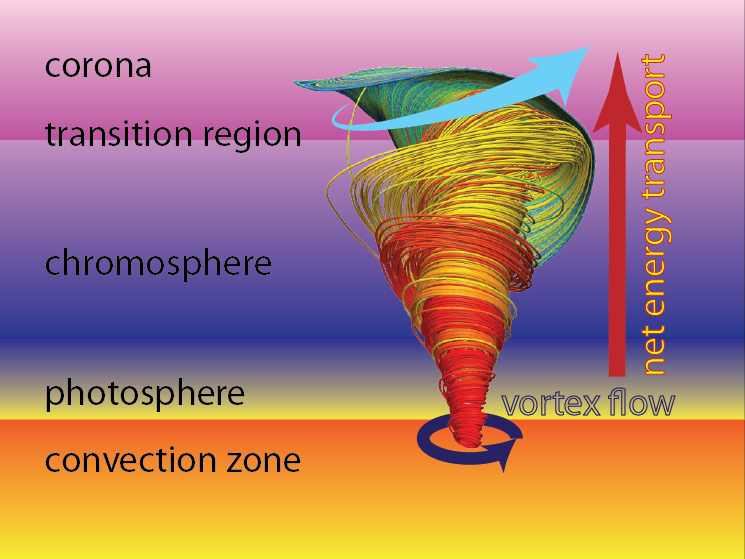
Schematic view of the atmospheric layers of the Sun, the extent of simulated magnetic tornado, and the resulting net energy transport. Image released June 27, 2012.
Granulation Pattern and Swirl Signature
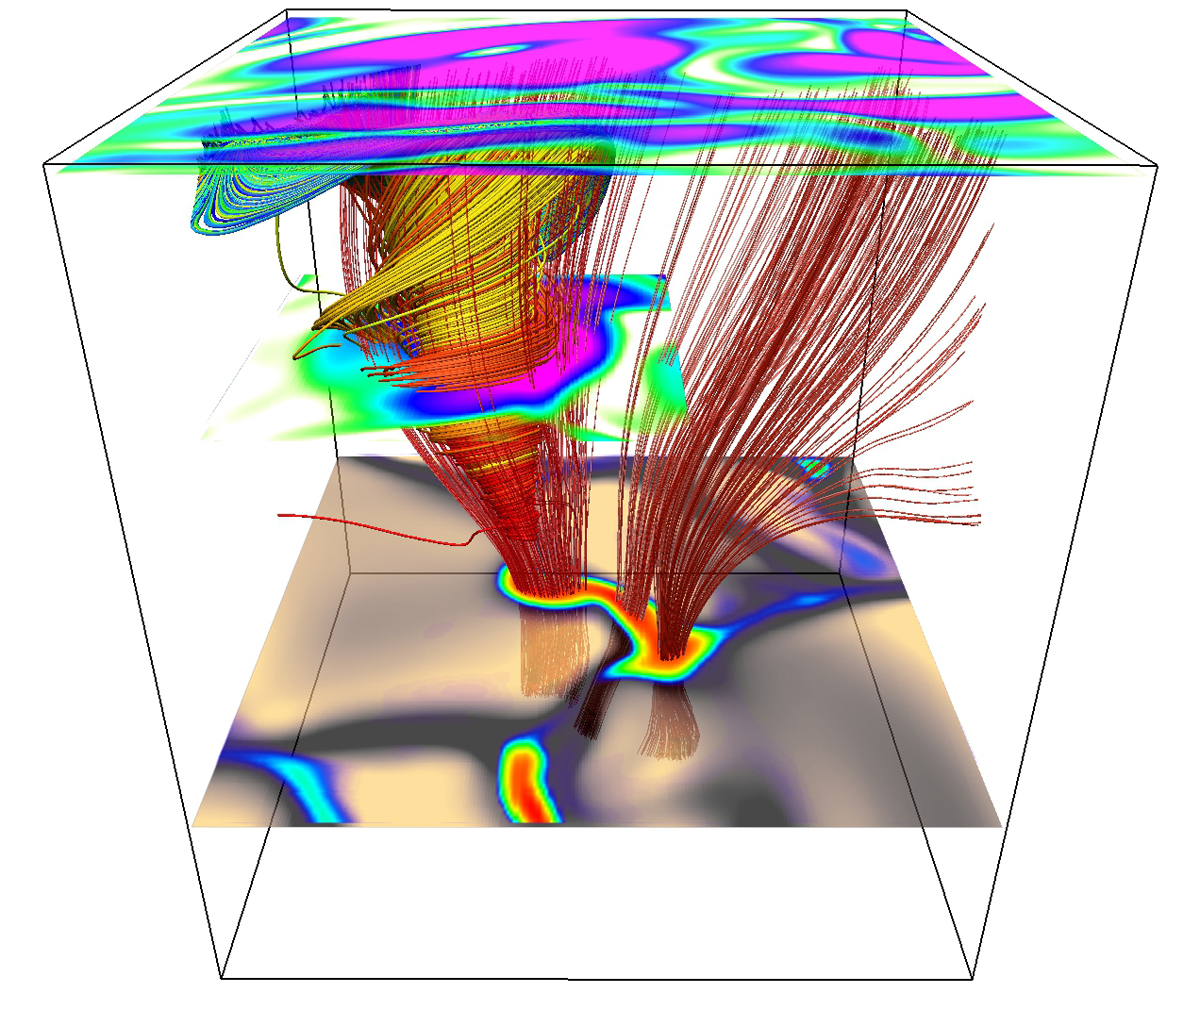
isualisation of a close-up region in our advanced 3D numerical simulations. The red mostly vertical lines represent the magnetic field, whereas the spiral lines represent the streamlines of the ionized gas in the magnetic tornado. The lower plane shows the granulation pattern of the solar surface and the magnetic footpoints (red), whereas the swirl signature (pink ring) can be seen on the top. Image released June 27, 2012.
Visualisation of a Close-Up Region
Visualisation of a close-up region in our advanced 3D numerical simulations. The red mostly vertical lines represent the magnetic field, whereas the spiral lines represent the streamlines of the ionized gas in the magnetic tornado. The lower plane shows the granulation pattern of the solar surface and the magnetic footpoints (red), whereas the swirl signature (pink ring) can be seen on the top. Image released June 27, 2012.
Breaking space news, the latest updates on rocket launches, skywatching events and more!
Group Photo of International Research Collaboration
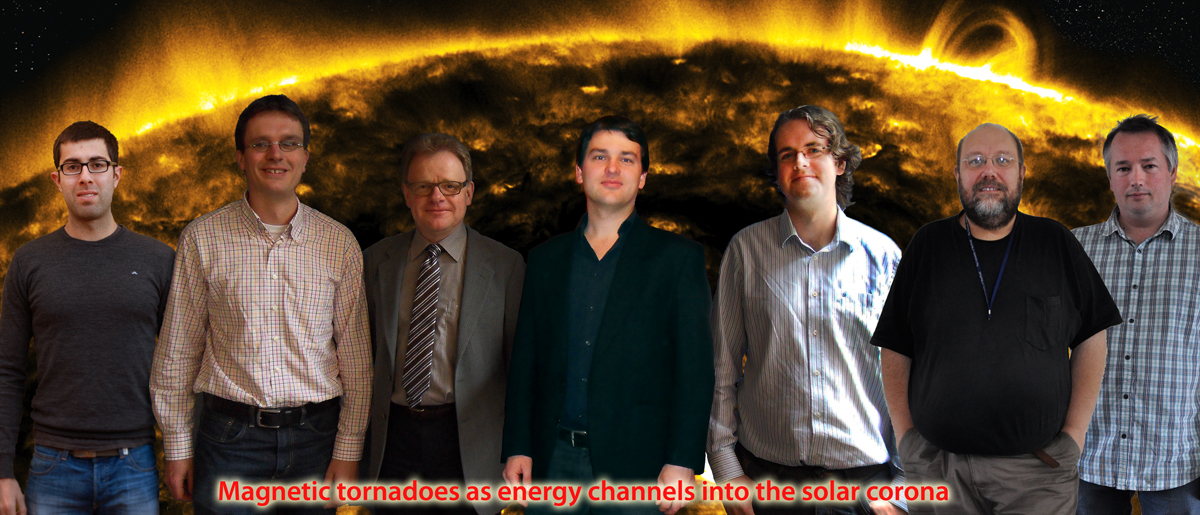
Group photo (montage) with all members of the international research collaboration who made the discovery. From left to right: Dr. J. de la Cruz Rodriguez, Dr. L. Rouppe van der Voort, Dr. O. Steiner, Dr. S. Wedemeyer-Böhm, Dr. E. Scullion, Prof. Dr. R. Erdélyi, Dr. V. Fedun. Image released June 27, 2012.
First Four Authors
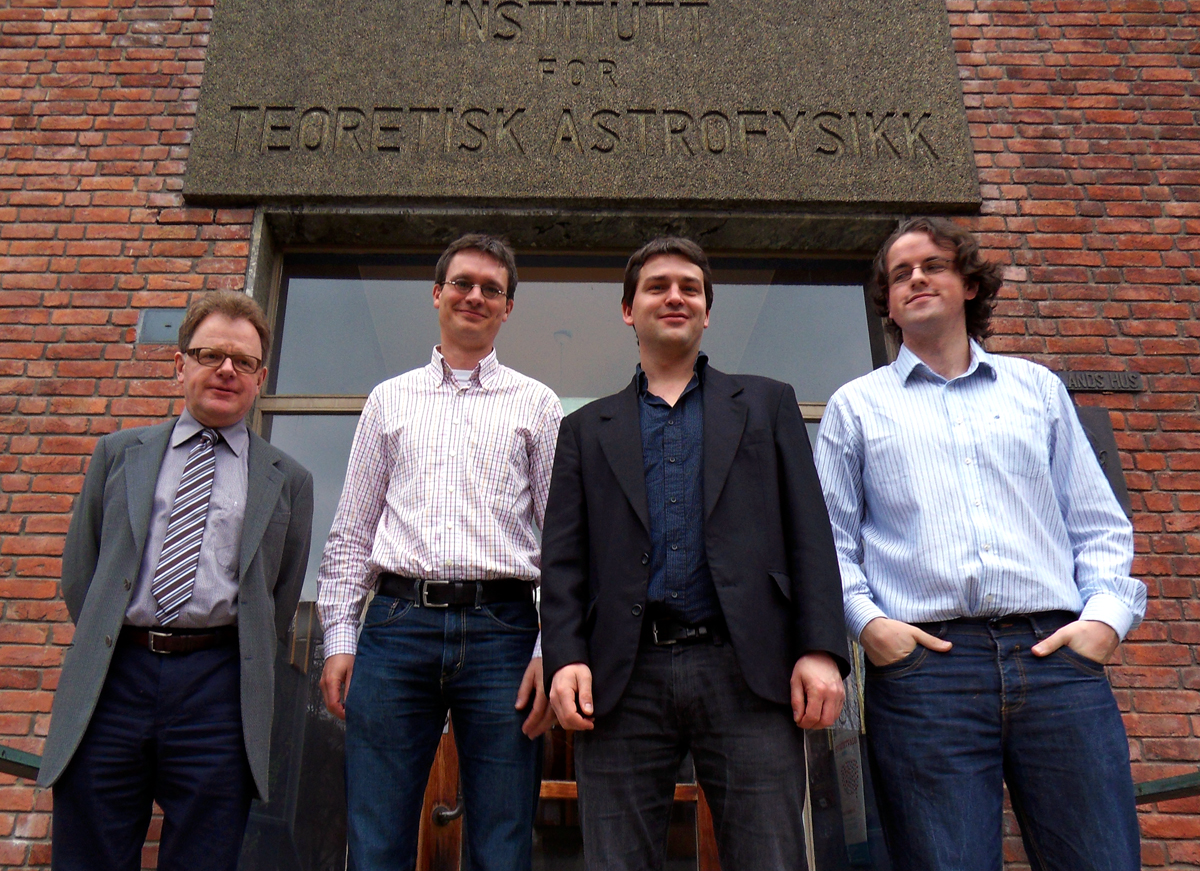
The first four authors in front of the Institute of Theoretical Astrophysics, University of Oslo, Norway. From left to right: Dr. Oskar Steiner, Dr. Luc Rouppe van der Voort, Dr. Sven Wedemeyer-Böhm and Dr. Eamon Scullion. Image released June 27, 2012.
First Example of a Tornado in a Numerical Simulation of a Cool Star
First example of a tornado in a numerical simulation of a cool star with a surface temperature of 3200 K (compared to the Sun with 5780 K). This unpublished result will be presented for the first time at the 17th Cambridge Workshop on Cool Stars, Stellar Systems and the Sun on June 28th, 2012, in Barcelona, Spain. Image released June 27, 2012.

Space.com is the premier source of space exploration, innovation and astronomy news, chronicling (and celebrating) humanity's ongoing expansion across the final frontier. Originally founded in 1999, Space.com is, and always has been, the passion of writers and editors who are space fans and also trained journalists. Our current news team consists of Editor-in-Chief Tariq Malik; Editor Hanneke Weitering, Senior Space Writer Mike Wall; Senior Writer Meghan Bartels; Senior Writer Chelsea Gohd, Senior Writer Tereza Pultarova and Staff Writer Alexander Cox, focusing on e-commerce. Senior Producer Steve Spaleta oversees our space videos, with Diana Whitcroft as our Social Media Editor.
