Seeing Spots: NASA Video Shows 7 Years of Solar Activity

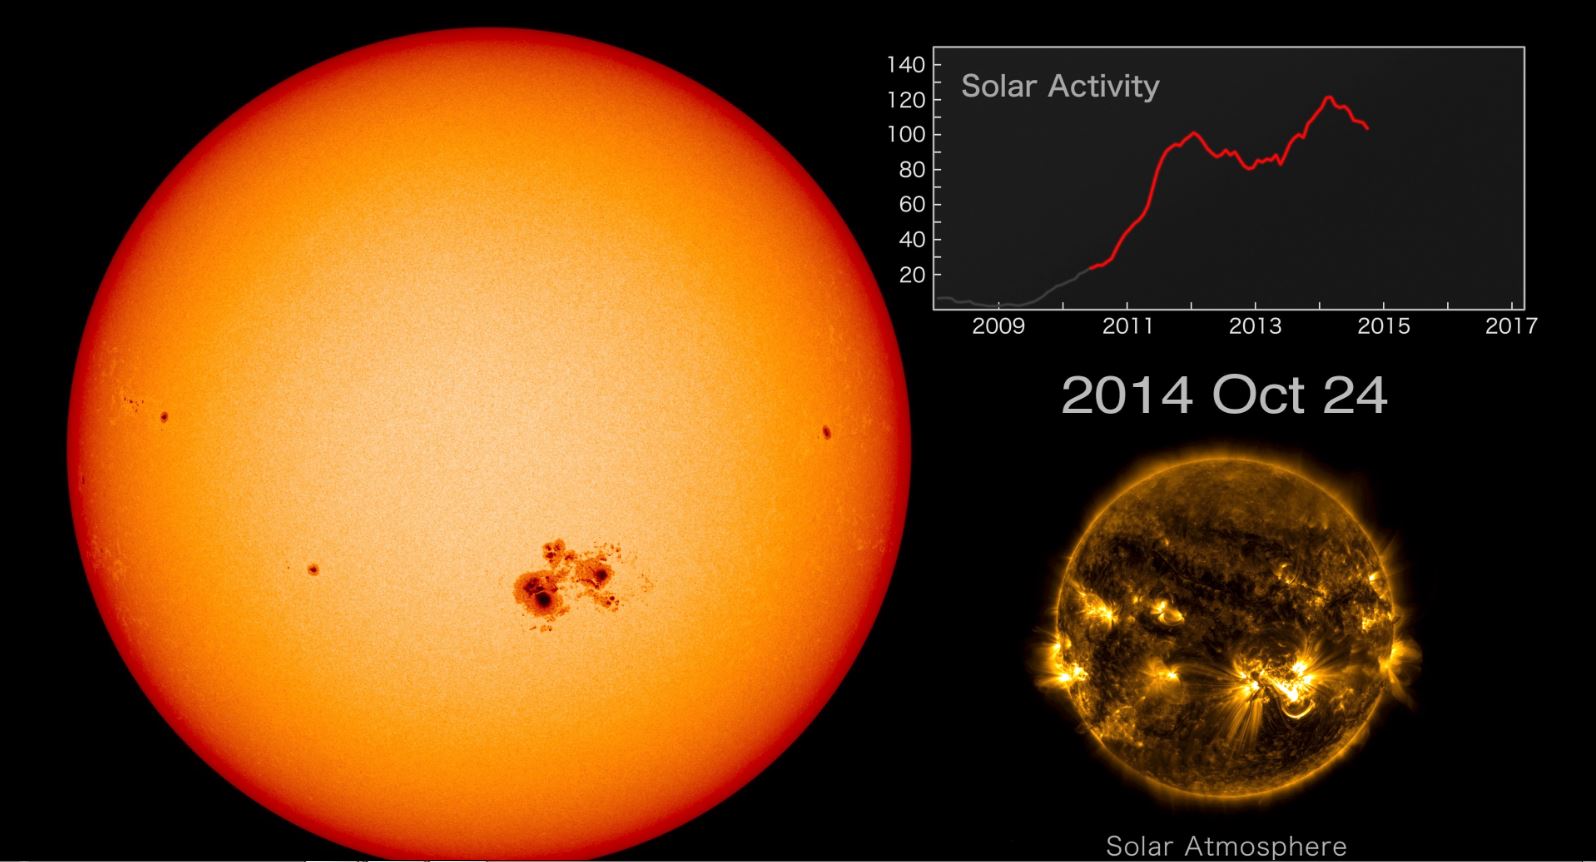
Watch the sun break out in spots over and over again in a new NASA video of the sun showing seven years of sunspot footage, collected by the agency's Solar Dynamics Observatory (SDO).
The SDO launched in December 2009 and has been in space long enough to see most of an 11-year solar cycle, which is characterized by a peak in activity, such as the appearance of sunspots and explosions of material from the surface. The mission is intended to help scientists learn more about the sun's influence on the Earth by studying the sun's atmosphere. In 2013, the SDO and other observatories observed the most muted solar peak in 100 years, which is captured in the video. Data in the video is represented up to January 2017.
The larger, orange sun on the left side of the screen represents visible light captured by the HMI (Helioseismic and Magnetic Imager). The black dots are sunspots, which are concentrations of magnetic fields that appear darker than the surroundings. Simply put, larger and more frequent sunspots tend to correlate with more solar activity. [Sunspot Photos: Amazing Views of Spots on the Sun]
The smaller, golden sun in the lower right shows the star in extreme ultraviolet wavelengths, based on data from the SDO's Atmospheric Imaging Assembly (AIA). Here you can see some of the corona, which is the sun's outer atmosphere. Scientists are still trying to figure out why the corona has a temperature in the millions of degrees, while the surface is at 10,000 degrees Fahrenheit (5,500 degrees Celsius.) A phenomenon called "heat bombs," which occur when magnetic fields cross in the corona and realign, may be partially responsible.
The graph in the upper-right corner of the video screen "shows the sunspot number, a measurement based on the number of individual spots and the number of sunspot groups," NASA added in a statement. "In this case, the line represents a smoothed 26-day average to more clearly show the overall trend."
And although solar energy is essential for life on Earth, solar activity can wreak havoc on satellites and even ground-based power grids, potentially damaging Earth's power and communication infrastructures.
Forecasting and preparing for such events is one reason why NASA and governments worldwide are interested in learning more about how the sun works.
Breaking space news, the latest updates on rocket launches, skywatching events and more!
Follow Elizabeth Howell @howellspace, or Space.com @Spacedotcom. We're also on Facebook and Google+. Original article on Space.com.

Elizabeth Howell (she/her), Ph.D., was a staff writer in the spaceflight channel between 2022 and 2024 specializing in Canadian space news. She was contributing writer for Space.com for 10 years from 2012 to 2024. Elizabeth's reporting includes multiple exclusives with the White House, leading world coverage about a lost-and-found space tomato on the International Space Station, witnessing five human spaceflight launches on two continents, flying parabolic, working inside a spacesuit, and participating in a simulated Mars mission. Her latest book, "Why Am I Taller?" (ECW Press, 2022) is co-written with astronaut Dave Williams.
