2018 Was the 4th Hottest Year on Record. Here's How NASA Knows.
It's official: 2018 was the fourth hottest year on record, scientists at NASA and NOAA confirmed in a report released today (Feb. 6).
The report is the latest installment of a yearly analysis that compares the two agencies' independent global temperature measurements with historical data. Both of those agencies' datasets are produced purely from observations gathered at ground stations around the world. But satellites play an important role in validating that data, offering additional information about climate and helping the agencies track climate processes.
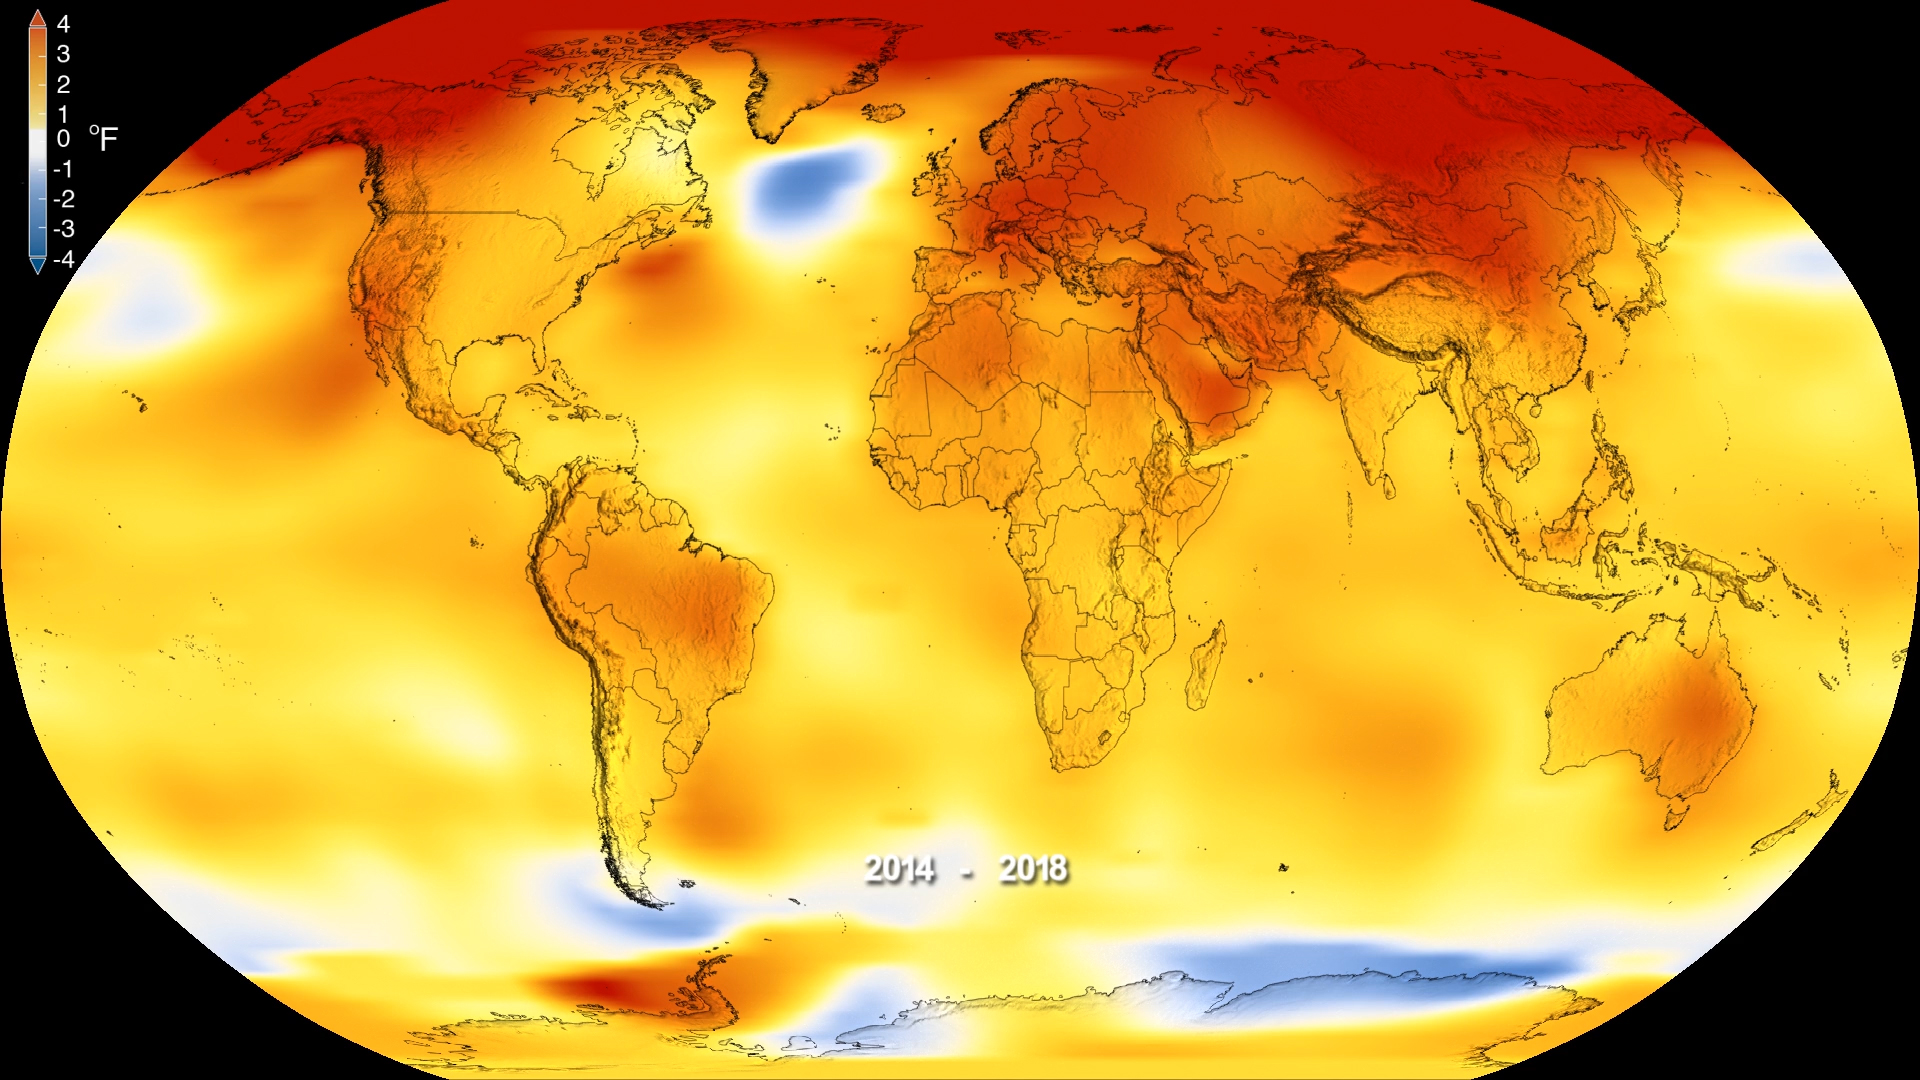
All the data points to one conclusion: 2018 was hotter than every single year between 1880 and 2014; only the three prior years were warmer than last year. "Across the globe, 2018 was extremely warm, with only a few places that were below our normal period [which runs from 1951 to 1980]," Gavin Schmidt, a climate scientist and director of NASA's Goddard Institute for Space Studies, said during a news conference held to announce the report. NOAA's separate analysis confirmed the fourth-place finish. [NASA's Best Earth-from-Space Photos by Astronauts in 2017 (Gallery)]
It isn't unusual to see annual changes that seem to buck the overall warming pattern, like the apparent cooling on display between 2016 and 2018. "You do tend to see some bouncing up and down superimposed upon a long-term trend," Deke Arndt, who leads global monitoring at NOAA's National Centers for Environmental Information, said during the news conference. "The global temperature series when presented in this way very much resembles riding up an escalator over time, and then jumping up and down while you're on that escalator."
Both of the new analyses are based exclusively on data gathered from ground stations because that gives scientists a longer continuous series of matching measurements — back to 1880, long before humans had satellites studying climate as well. Comparing ground-based and satellite data faces the proverbial apples-to-oranges challenge. But those satellites are still crucially important to studying climate.
In the case of the new analyses, scientists cross-referenced them with data gathered by an instrument called Atmospheric Infrared Sounder (AIRS) on NASA's Aqua satellite, which has been orbiting Earth since 2002. That comparison supported the main finding of the analyses, but added an extra note of concern about warming in the Arctic.
"The trends in the patterns are very congruent, but with an indication that the Arctic is warming more in the satellite trends than we are capturing in the station-based analyses," Schmidt said. "That's obviously something that scientifically we're going to be looking into going forward."
Breaking space news, the latest updates on rocket launches, skywatching events and more!
Aqua is one of a fleet of climate satellites nicknamed the A-Train, which are studying a range of climate variables: not just temperature, but also factors like humidity and cloudiness. That data is crucial for rounding out the climate picture, according to Schmidt. "Without that, we would really be flying blind," he said.
Email Meghan Bartels at mbartels@space.com or follow her @meghanbartels. Follow us @Spacedotcom and Facebook. Original article on Space.com.

Meghan is a senior writer at Space.com and has more than five years' experience as a science journalist based in New York City. She joined Space.com in July 2018, with previous writing published in outlets including Newsweek and Audubon. Meghan earned an MA in science journalism from New York University and a BA in classics from Georgetown University, and in her free time she enjoys reading and visiting museums. Follow her on Twitter at @meghanbartels.

