


CryoSat Reveals Iceberg
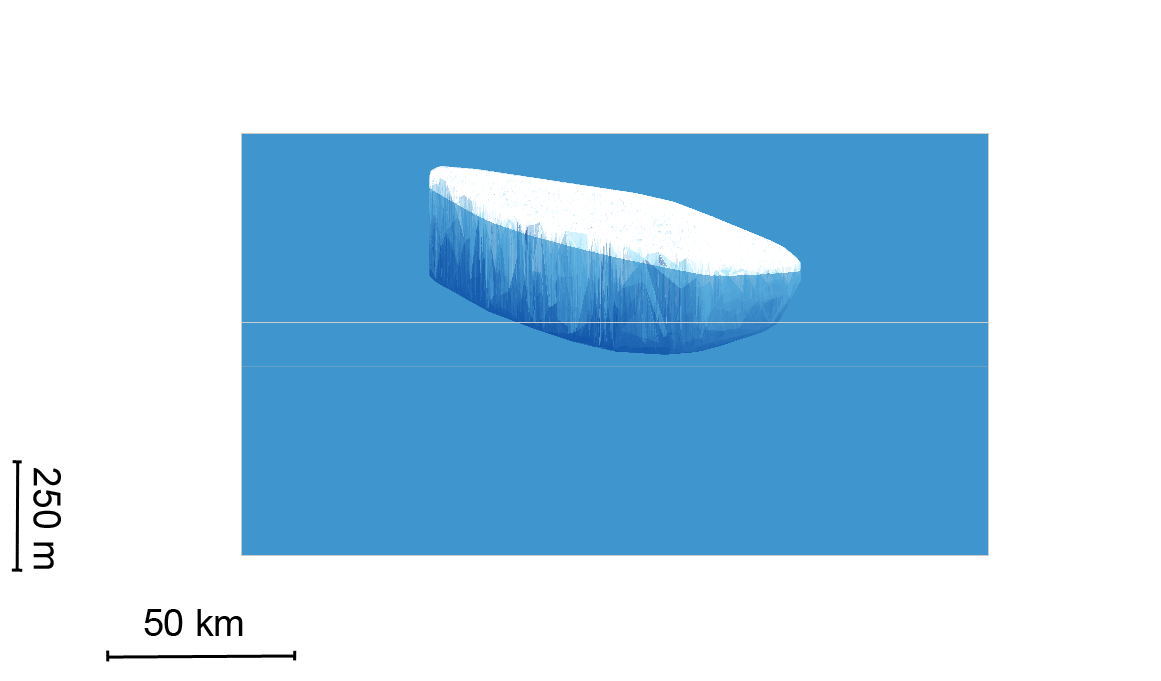
ESA's CryoSat mission measured the thickness of the eventual iceberg. On average, it is 620 feet (190 meters) thick, but at its thickest point, it has a keel that's 690 feet (210 m) below the ocean surface. It contains about 277 cubic miles (1,155 cubic kilometers) of ice. [Antarctica's Larsen C Iceberg Will Tower 600 Feet Over the Ocean]
NEXT: Larsen Crack Opens Up
Larsen Crack Opens Up
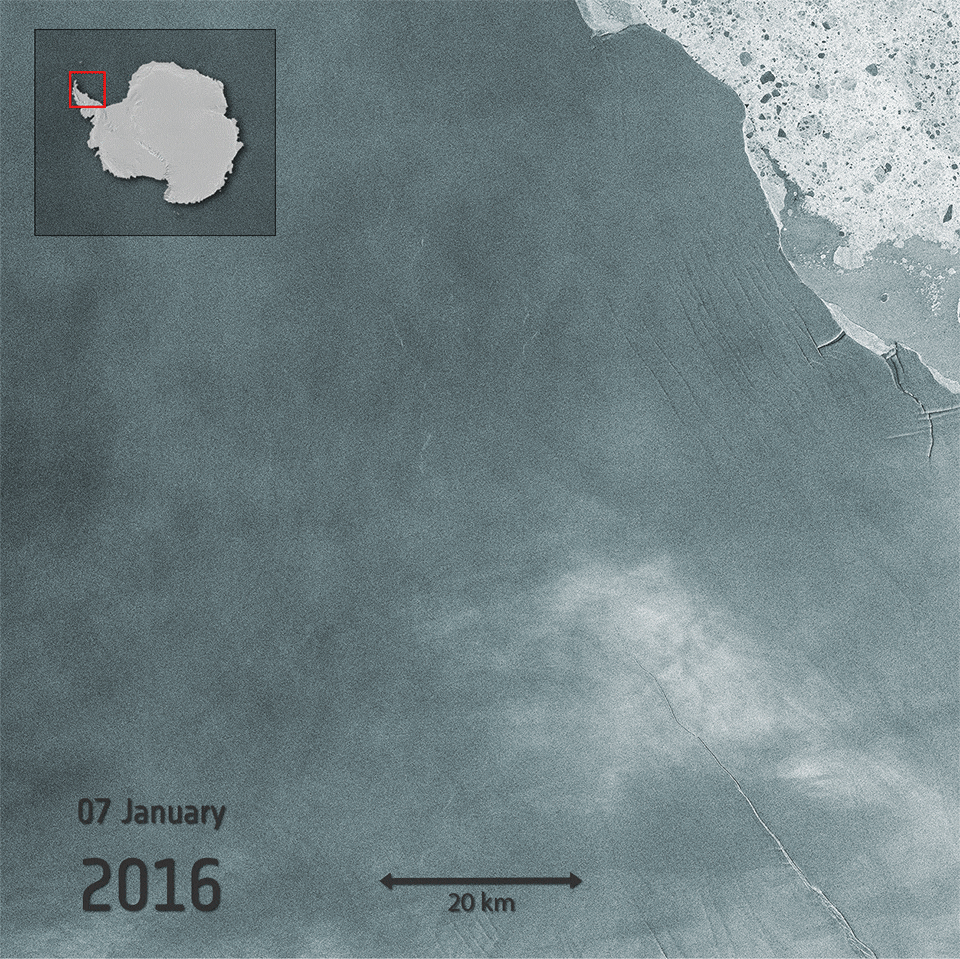
This animation shows how the crack in the Larsen C ice shelf grew from January 2016 to January 2017. Carrying a radar instrument that can "see" through the dark, the Sentinel-1 satellites continuously monitored the growing crack. [Video: Antarctica's Growing Ice Shelf Crack Monitored from Space]
NEXT: Monitoring the Rift
Monitoring the Rift
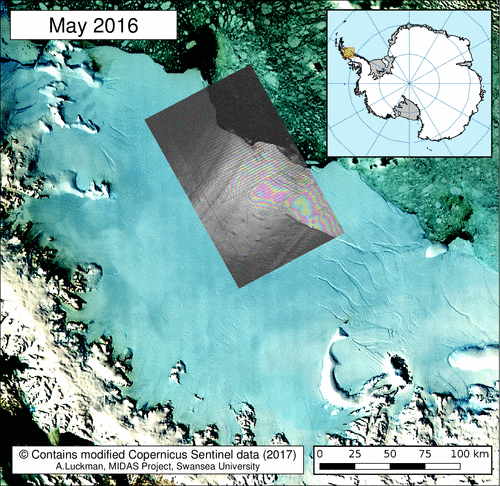
This animation shows how the rift in the Larsen C ice sheet has grown over the last 13 months. Scientists from Project MIDAS, an Antarctic research consortium led by Swansea University in the United Kingdom, used radar images from the Sentinel-1 mission to keep tabs on the situation.
NEXT: Aqua Satellite View
Aqua Satellite View

Thermal image of the large iceberg that calved off the Larsen C ice shelf. Darker colors indicate where the ice is colder, and brighter colors are warmer. The rift appears as a thin line of slightly warmer area. NASA's Aqua satellite captured this image on July 12, 2017.
NEXT: Landsat 8 View
Landsat 8 View

On June 17, 2017, the Thermal Infrared Sensor (TIRS) on NASA's Landsat 8 captured this false-color image of the crack in the Larsen C ice shelf. Orange depicts where the surface is the warmest, while light blues and whites are the coldest areas.
NEXT: A Closer Look
A Closer Look

In this zoomed-in view of the thermal image taken by the Landsat 8 satellite, the blue hue of the crack indicates that relatively warm ocean water is not far below the surface of the ice shelf.
NEXT: A Decade of Growth
A Decade of Growth
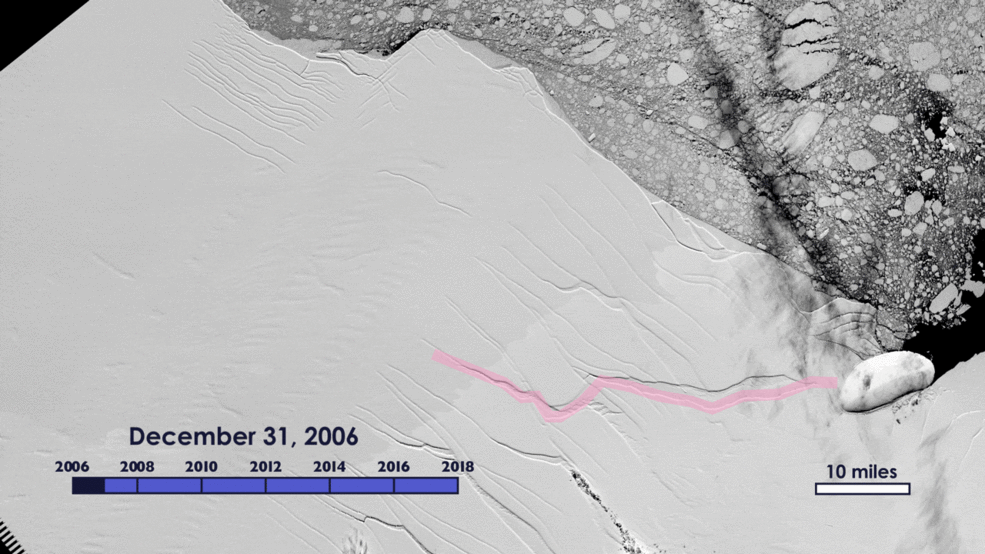
This animation shows the growth of the crack in the Larsen C ice shelf from 2006 to 2017, as seen from Landsat satellites.
