
NASA Satellites Show How Our Icy World Is Melting
The melt-off from the world's ice sheets, ice caps and glaciers over eight years of the past decade would have been enough to cover the United States in about 18 inches (46 centimeters) of water, according to new research based on the most-comprehensive analysis of satellite data yet.
Data, collected for the years 2003 through 2010, indicates that melting ice raised sea levels worldwide by an average of 1.48 millimeters (0.06 inches) each year. The loss of ice from Greenland and Antarctica has already been measured using satellite data, but the new analysis revealed that melting ice elsewhere accounted for about 0.41 mm (0.016 inches) of the annual rise.
Until now, satellite measurements from only selected places were used to extrapolate the overall ice loss outside Greenland and Antarctica. [Stunning Photos of Antarctic Ice]

"The Earth is losing an incredible amount of ice to the oceans annually, and these new results will help us answer important questions in terms of both sea rise and how the planet's cold regions are responding to global change," study researcher John Wahr, a professor of physics at the University of Colorado, said in a press release issued by the Boulder campus.
Climate change, spurred by greenhouse gases released into the atmosphere by humans, is believed to be the culprit. Warming raises sea levels not only by melting ice — the aspect examined in this study — but by causing water to expand.
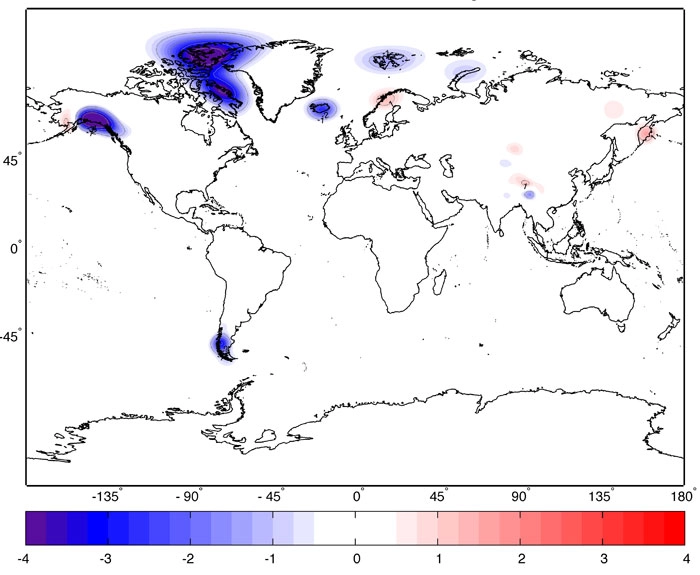
For the first time, the researchers used the satellite system called GRACE (for "Gravity Recovery and Climate Experiment") to look at loss of ice by glaciers and ice caps around the world.
GRACE, operated by NASA and Germany, already had been used to study ice sheets on Antarctica, Greenland and other large ice-covered areas.
"But so far the data have not been analyzed simultaneously and consistently for all areas," Jonathan Bamber, of the Glaciology Centre at the University of Bristol in the United Kingdom, wrote in a commentary published along with the study in the Feb. 9 issue of the journal Nature.
The new data confirmed that most of the melting happened on ice-covered Greenland and Antarctica, where enough ice melted to raise sea levels by 1.06 millimeters (0.042 inches) per year between January 2003 and December 2010, the study period.
There are more than 160,000 glaciers and ice caps worldwide, but annual changes in mass have been directly measured for only 120 of them, and in most cases only within the last 30 years, according to Bamber.
GRACE consists of two satellites that travel around the Earth together, picking up on changes in the Earth's gravitational field, which are linked to changes in mass. The researchers devised a way to separate out the changes in mass for ice-covered regions around the globe.
Their results yielded two surprises: The melt rate for glaciers and ice caps outside Antarctica and Greenland made a smaller contribution to sea-level rise than had been estimated, and the melt rate in the Asian mountains, including the Himalayas, was dramatically lower: 4 billion tons annually versus up to 50 billion.
In his commentary, Bamber notes that the study period was too brief to capture large fluctuations in melting from some areas, such as in the Gulf of Alaska and the high Asian mountains.
"Nonetheless, Jacob and colleagues have dramatically altered our understanding of recent global (glacier and ice cap) volume changes, and their contribution to sea-level rise," Bamber wrote, referring to study researcher Thomas Jacob of Colorado-Boulder. "Now we need to work out what this means for estimating their future response."
This story was provided by LiveScience.com, a sister site to SPACE.com. You can follow LiveScience senior writer Wynne Parry on Twitter @Wynne_Parry. Follow LiveScience for the latest in science news and discoveries on Twitter @livescience and on Facebook.
