Satellites Spy Seafloor Focusing Tsunami Waves

Breaking space news, the latest updates on rocket launches, skywatching events and more!
You are now subscribed
Your newsletter sign-up was successful
Want to add more newsletters?

Delivered daily
Daily Newsletter
Breaking space news, the latest updates on rocket launches, skywatching events and more!

Once a month
Watch This Space
Sign up to our monthly entertainment newsletter to keep up with all our coverage of the latest sci-fi and space movies, tv shows, games and books.

Once a week
Night Sky This Week
Discover this week's must-see night sky events, moon phases, and stunning astrophotos. Sign up for our skywatching newsletter and explore the universe with us!

Twice a month
Strange New Words
Space.com's Sci-Fi Reader's Club. Read a sci-fi short story every month and join a virtual community of fellow science fiction fans!
As the waves of a tsunami approach a coastline, the topography of the seafloor near the coast plays a major role in determining how large those waves become and what places get hit harder than others.
For example, when the waves of the massive tsunami generated by last year's magnitude 9.0 Japan earthquake crossed the Pacific Ocean and reached the U.S. West Coast, they hit Crescent City, Calif., particularly hard because of two features of the seafloor off the coast: a piece of the ocean floor raised by tectonic activity that runs directly toward the city and the position and shape of the city's harbor.
Scientists had suspected that the same phenomenon might also take place in the deep ocean, where underwater mountains, called seamounts, chasms and even islands could deflect tsunami waves in some places and amplify them in others.
But measurements taken by satellites passing over the waves of last year's tsunami have confirmed that this happens, even at large distances from a quake's epicenter.
Researchers from NASA's Jet Propulsion Laboratory and Ohio State University used satellite altimeters, which can measure sea level changes in very fine detail, to observe "merging tsunamis" — a phenomenon where smaller waves merge to form one bigger wave. These waves can travel hundreds to thousands of miles without losing power.
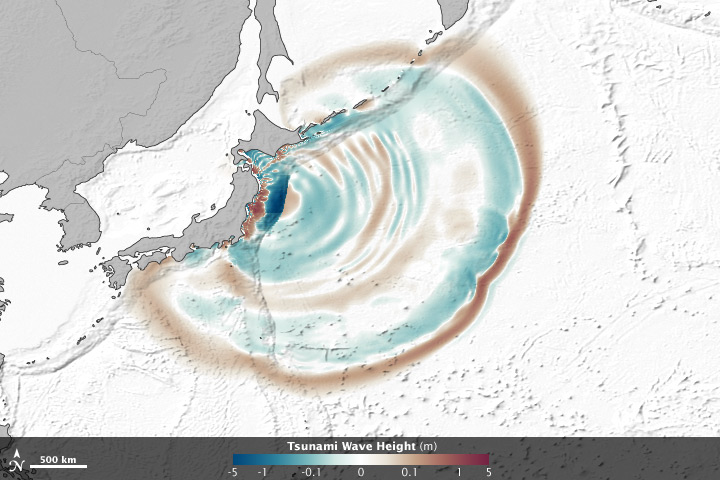
The measurements showed that the March 2011 tsunami doubled in intensity when passing over rugged ocean ridges and around islands in the middle of the Pacific.
The team used a computer-based model to translate the measurements into images and animations, which shows how the waves can refract, bend and merge as they propagate. The peaks of waves are colored red-brown, while depressions in sea surface appear blue-green. Grayscale outlines show the location of mid-ocean ridges, peaks and islands.
Breaking space news, the latest updates on rocket launches, skywatching events and more!
The measurements came from the Jason-1, Jason-2, and Envisat satellites, which each flew over the tsunami at a different location.
"It was a one in 10 million chance that we were able to observe this double wave with satellites," said Tony Song, principal investigator of the study and a scientist at JPL.
"Researchers have suspected for decades that such ‘merging tsunamis’ might have been responsible for the 1960 Chilean tsunami that killed about 200 people in Japan and Hawaii, but nobody had definitively observed a merging tsunami until now. It was like looking for a ghost," Song said. "Jason happened to be in the right place at the right time to capture the double wave."
This story was provided by OurAmazingPlanet, a sister site to SPACE.com.
For the science geek in everyone, Live Science breaks down the stories behind the most interesting news and photos on the Internet, while also digging up fascinating discoveries that hit on a broad range of fields, from dinosaurs and archaeology to wacky physics and astronomy to health and human behavior. If you want to learn something interesting every day, Live Science is the place for you.

