A new NASA model is showing just how fast sea levels are rising around the world as a result of climate change.
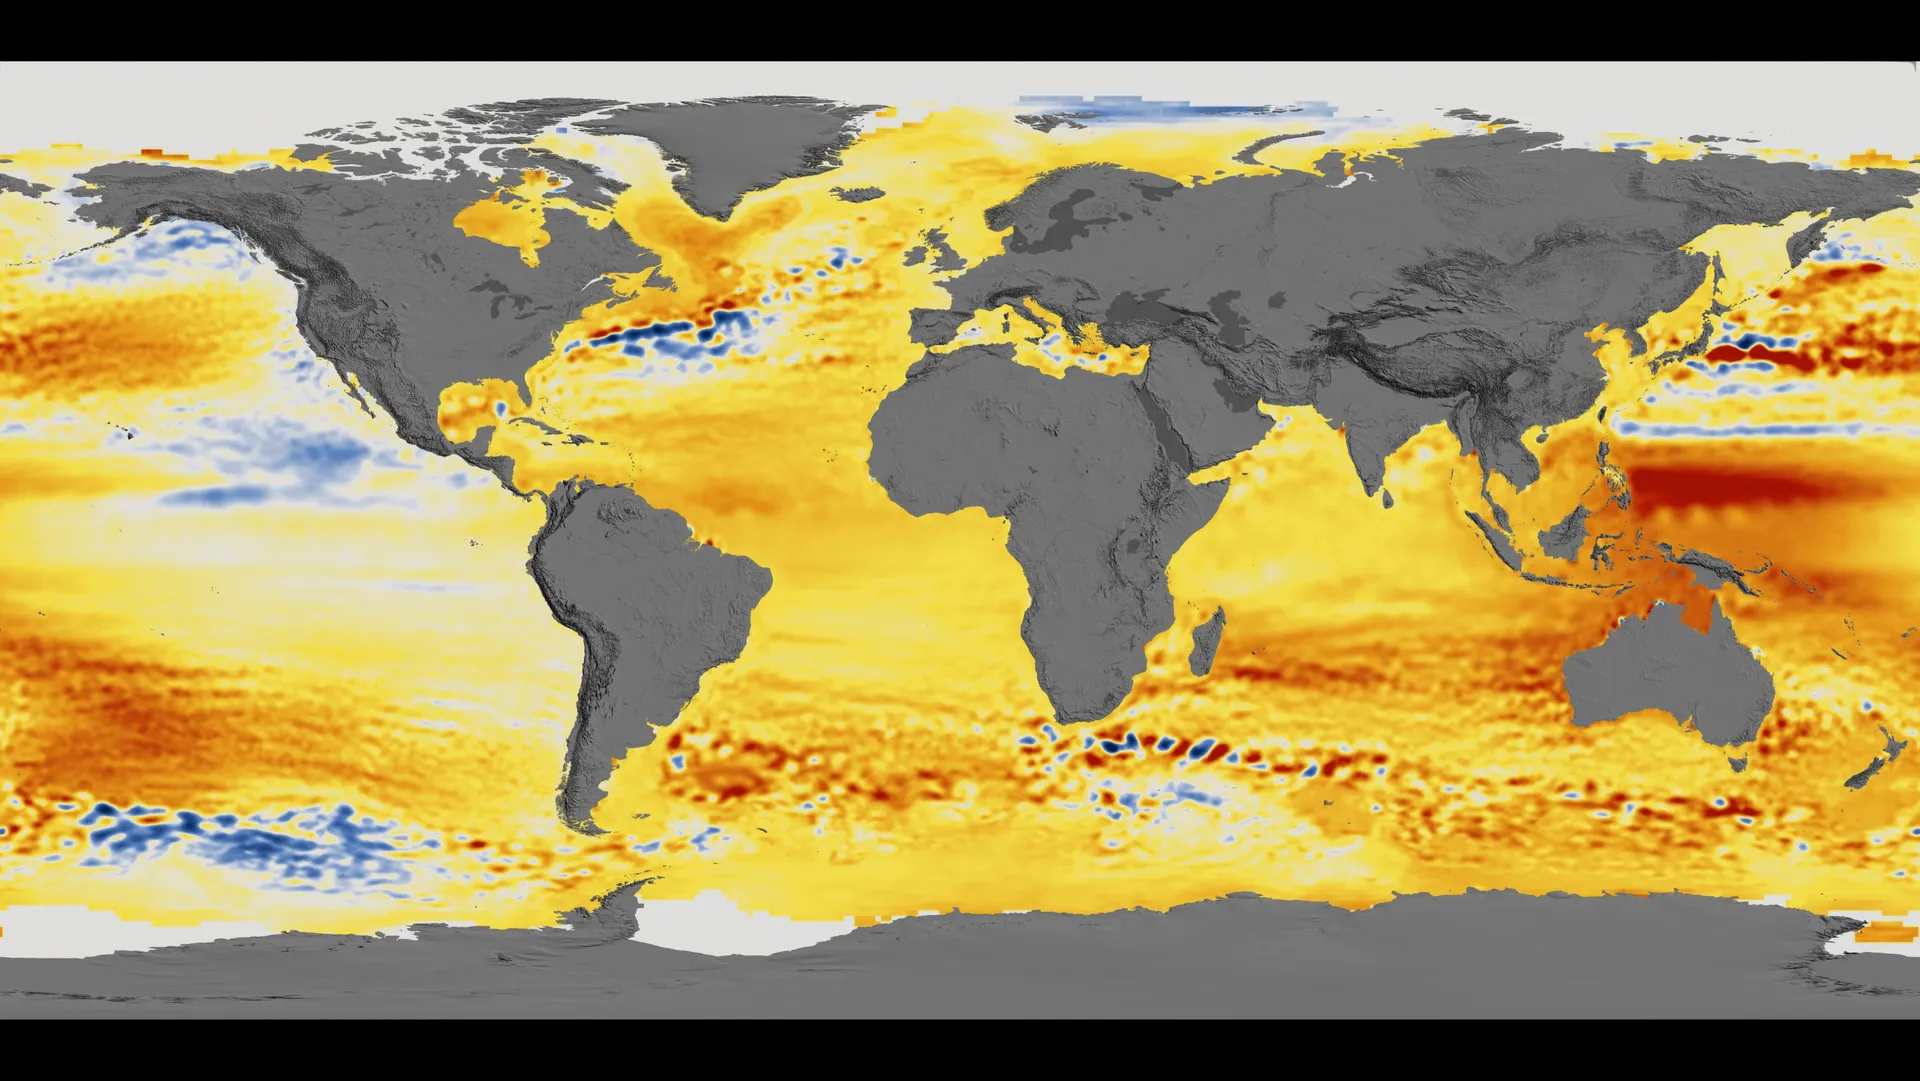
At a news conference today (Aug. 26), NASA officials described a new computer visualization of sea level change incorporating data collected by satellites since 1992 — it reveals that sea levels are rising quickly but unevenly across the globe. The space agency will continue to investigate the global phenomenon, and new satellite missions in the coming years will increase researchers' knowledge of the topic, officials said.
"Sea level rise is one of the most visible signatures of our changing climate, and rising seas have profound impacts on our nation, our economy and all of humanity," Michael Freilich, director of NASA's Earth Science Division at the agency's headquarters in Washington, D.C., said at the news conference. [Climate Change Impact: NASA's 21st Century Predictions (Video)]
"By combining space-borne direct measurements of sea level with a host of other measurements from satellites and sensors in the oceans themselves, NASA scientists are not only tracking changes in ocean heights but are also determining the reasons for those changes," Freilich added.
As Earth heats up, sea levels are rising because of three main factors: the expansion of seawater as it warms, melting ice sheets in places like Greenland and Antarctica, and melting glaciers across the world. Each of these factors seems to be contributing relatively equally to sea level rise right now, and NASA is deploying tools to better understand and model all three.
NASA's data reveals that, although the picture is complex, sea levels overall are rising faster than they were 50 years ago — more quickly than expected — and that the speed will likely increase in the future, primarily because of melting ice sheets.
To study sea levels, NASA has used satellite altimetry, which measures the time a radar burst takes to hit Earth's surface and return to orbiting spacecraft such as TOPEX/Poseidon, Jason 1 and then Jason 2. The measurement is extremely precise: Freilich mentioned that such a tool mounted on a jetliner flying at 40,000 feet (12,200 meters) would be able to detect the bump caused by a dime lying flat on the ground. NASA's ICESat satellite also keeps tabs on ice-sheet height with pulses of laser light.
The model also incorporates data from GRACE, twin satellites that are very sensitive to changes in Earth's mass distribution. The distance between the two spacecraft varies as ice and water move around on the planet, Steve Nerem, who leads NASA's Sea Level Change Team at the University of Colorado, Boulder, said at the news conference — and the GRACE duo can measure those changes to within the diameter of a red blood cell. [8 Ways Global Warming Is Already Changing the World]
A follow-up to the GRACE mission is expected to launch in 2017, officials said, as is ICESat-2. Jason 3 was scheduled to launch this month by SpaceX, but it must be rescheduled because of SpaceX's recent failed resupply mission to the International Space Station. And NASA has more satellites in the pipeline for later on, such as the radar-imaging NISAR (Nasa-Isro Synthetic Aperture Radar) and SWOT (Surface Water and Ocean Topography) missions in 2020.
In 2014, NASA formed a new sea-level-change research team comprising scientists with expertise in glaciology, hydrology, oceanography, geophysics and a variety of other fields, Nerem said. "You need all these fields … to actually understand all the factors that affect future sea level rise," he noted.
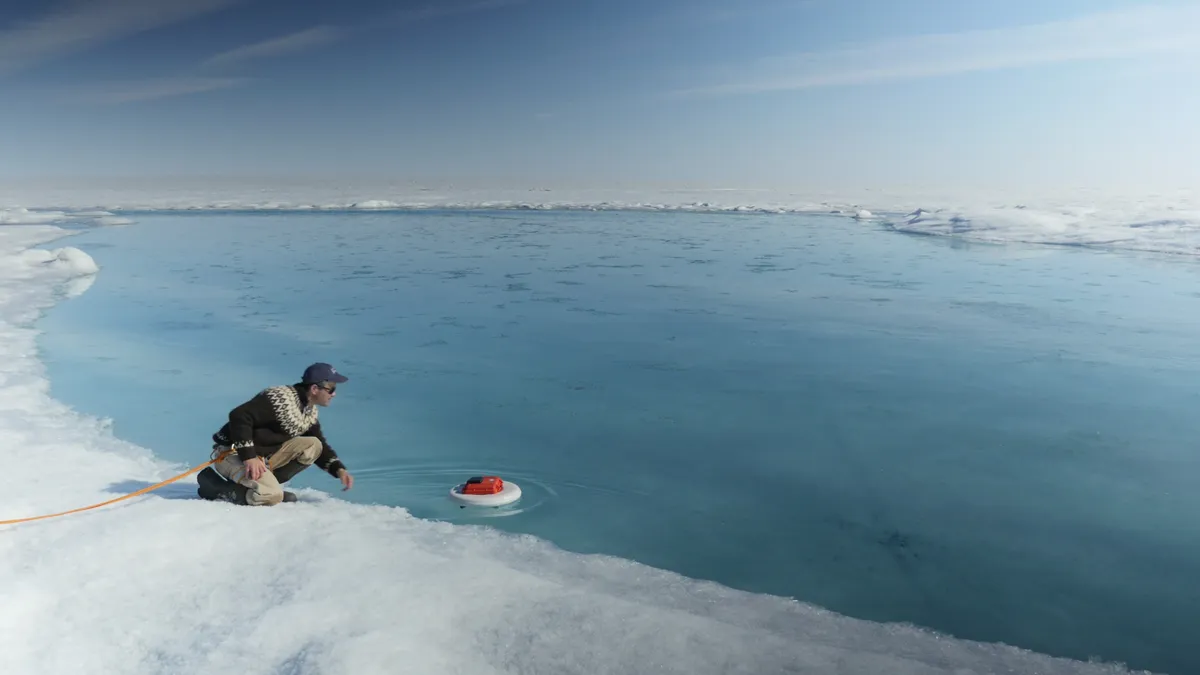
In addition to doing satellite-based research, NASA scientists are venturing out by land and sea to better understand the Earth's changes. A major new effort, called Oceans Melting Greenland (OMG), will begin by mapping the seafloor near Greenland with underwater probes, to see how the huge island's contours are guiding melting. Greenland's ice sheet alone would raise sea levels globally by 20 feet (6 m) if all of it were to melt, researchers said.
Starting in September, NASA will also perform several sweeps over Greenland, with instruments on the HU-25C Guardian Falcon plane for Operation IceBridge.
"When you look across Alaska, Greenland and Antarctica, you see a whole range of climate variables," said Eric Rignot, a glaciologist based at the University of California, Irvine and NASA's Jet Propulsion Laboratory in Pasadena, California. "Looking at Alaska's glaciers tells us what Greenland will look like in a century or a few centuries. What's happening in Greenland is relevant to what's going to happen to Antarctica in the future as well. They are all connected pieces of research."
The United Nations Intergovernmental Panel on Climate Change predicted in 2013 that sea level would rise by 1 to 3 feet (0.3 to 1 m) by the end of the century. But the uncertainties are significant, officials said, and the actual increase could wind up being much larger. The picture NASA is developing will help predict exactly what shape those changes will take.
"Let there be no doubt: This is relevant science, and it will result in understanding that yields direct societal benefit," Freilich said. "The effects and impacts of changing sea level are being felt now, in our country and throughout the world."
Email Sarah Lewin at slewin@space.com or follow her @SarahExplains. Follow us @Spacedotcom, Facebook and Google+. Original article on Space.com.
Join our Space Forums to keep talking space on the latest missions, night sky and more! And if you have a news tip, correction or comment, let us know at: community@space.com.